Market Conditions, Materials Drive November’s New Housing Price Increase
January 16, 2017
The New Housing Price Index (NHPI) rose 0.2% in November, following a 0.3% increase in October. The gain in November was largely attributable to higher prices in the combined region of Toronto and Oshawa as well as the census metropolitan area (CMA) of Vancouver.
The combined region of Toronto and Oshawa (+0.2%) was the top contributor to the national increase in November, while Vancouver (+0.5%) recorded the largest monthly price gain. Builders in both areas cited market conditions as the main reason for the advance. This was the largest increase in Vancouver since April 2015.
New housing prices rose 0.4% in Montreal, marking the largest increase in that CMA since October 2012. Builders attributed the gain to the cost of material.
St. John’s, Charlottetown and the combined region of Saint John, Fredericton and Moncton all recorded price increases of 0.2% in November.
The gain in St. John’s followed three months of no change, as builders reported higher prices for material, labour and land. In Charlottetown, builders attributed the price increase — the first following six months of flat or falling prices — to higher list prices in new phases of development. Builders in the combined region of Saint John, Fredericton and Moncton cited market conditions as the main reason for the price advance, following three months of no change.
After two consecutive months of decline, new housing prices rose 0.2% in St. Catharines-Niagara.
Prices were unchanged in 3 of the 21 metropolitan areas surveyed.
The CMAs of Halifax (-0.4%) and Saskatoon (-0.3%) recorded the largest price decreases in November. Builders in Halifax reported lower negotiated selling prices as the primary reason for the decline, while builders in Saskatoon lowered their prices to stimulate sales. This was the largest monthly decrease in Halifax in more than 15 years.
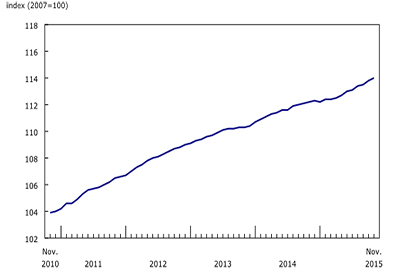
New Housing Price Index up 1.6% YOY
The NHPI increased 1.6% over the 12-month period ending in November. This was the largest year-over-year increase at the national level since December 2014.
The combined metropolitan region of Toronto and Oshawa (+4.1%) was the top contributor, recording the largest 12-month price increase in November. This was the largest year-over-year price gain in the region since January 2013.
Other notable increases were observed in Hamilton (+3.3%), Vancouver (+2.3%), Winnipeg (+1.7%), St. Catharines-Niagara (+1.3%) and Montreal (+1.1%). This was the largest 12-month increase in Vancouver since September 2010, and the largest year-over-year gain in Winnipeg since April 2014.
Among the 21 metropolitan areas surveyed, 6 posted year-over-year price declines in November: Regina (-1.6%), Saskatoon (-1.4%), Quebec City (-0.9%), Calgary (-0.8%), Victoria (-0.5%) and Ottawa–Gatineau (-0.5%). This was the largest year-over-year decline in Saskatoon since January 2010.
Source: Statistics Canada, www.statcan.gc.ca/daily-quotidien/160114/dq160114a-eng.htm.