Building Permits, February 2026

April 15, 2026
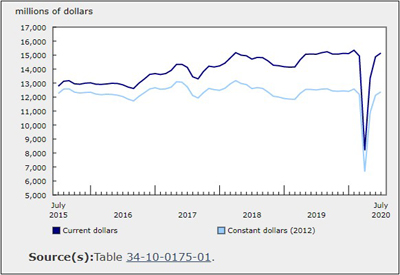
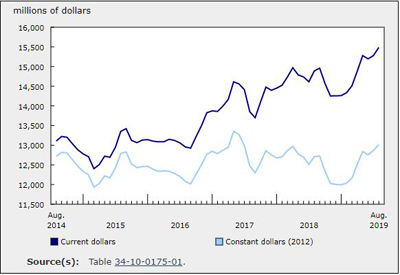
In February, the total value of building permits issued in Canada decreased by $1.1 billion (-8.4%) to reach $12.1 billion. The decline in construction intentions was led by the non-residential sector (-$1.3 billion) and tempered by the residential sector (+$135.6 million).
On a constant dollar basis (2023=100), the total value of building permits issued in February decreased 8.6% from the previous month and was down 11.5% on a year-over-year basis.
Chart 1
Total value of building permits, seasonally adjusted

Infographic 1
Building permits, February 2026

Non-residential sector declines in all components
The value of non-residential building permits fell 24.0% (-$1.3 billion to $4.0 billion) in February, the steepest decline since April 2023. The institutional component (-$987.2 million to $929.1 million) accounted for most of the decline in February 2026, while the commercial (-$160.0 million to $2.0 billion) and industrial (-$104.7 million to $985.1 million) components contributed to a lesser extent.
In February, the reduction in institutional construction intentions was primarily attributable to Ontario (-$827.1 million) and supported by Alberta (-$146.5 million) and Quebec (-$88.8 million). Concurrently, the commercial component marked its fourth consecutive decline, led by Ontario (-$106.6 million), as well as notable decreases recorded in Nova Scotia (-$51.9 million) and Alberta (-$40.0 million).
After leading growth in the industrial component in January, Quebec (-$186.4 million) drove the decrease in February, while British Columbia (+$283.3 million) helped moderate declines. The gain in British Columbia was concentrated in the Vancouver census metropolitan area (+$183.9 million), where the approval of a new wastewater treatment plant helped support growth in the province.
Chart 2
Number of units authorized for the residential sector and for the single-family and multi-family components

Chart 3
Value of building permits for the residential and non-residential sectors

Chart 4
Value of building permits for the single-family and multi-family components

Chart 5
Value of building permits for the industrial, commercial and institutional components

Multi-unit component leads residential increase
Residential construction intentions rose $135.6 million to $8.1 billion in February. The increase in the multi-unit component (+$180.3 million to $5.4 billion) was partially offset by a decline in the single-family component (-$44.7 million to $2.7 billion).
The rise in the multi-unit component in February was driven by Ontario (+$320.6 million) and was supported by British Columbia (+$217.6 million). Declines in Quebec (-$188.1 million), Nova Scotia (-$112.3 million) and Alberta (-$95.2 million) moderated the gain.
British Columbia (-$52.8 million) led the decrease in the single-family component in February, and an additional decline was recorded in Ontario (-$28.4 million). Meanwhile, Alberta (+$28.9 million) tempered these losses.
Nationwide, a total of 21,000 multi-unit dwellings and 3,900 single-family dwellings were authorized for construction in February, representing a 0.8% decrease from the previous month. From March 2025 to February 2026, the total number of multi-family dwellings authorized was 255,500, up from 244,600 during the previous 12-month period.