New Housing Price Rise Marginally in October
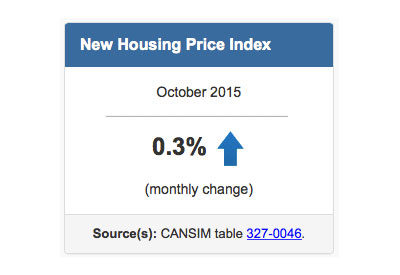
The New Housing Price Index (NHPI) rose 0.3% in October, following a 0.1% increase in September. The gain was largely attributable to higher new home prices in Ontario. Ten of the 21 metropolitan areas surveyed reported no price changes.
Chart 1: New Housing Price Index

The combined region of Toronto and Oshawa (+0.5%) was the top contributor to the increase, recording the largest monthly price advance among the census metropolitan areas (CMAs) covered by the survey. Market conditions and the higher cost of land were reported by some builders as the reasons for the increase.
Prices rose 0.4% in Victoria, as builders cited higher list prices for homes in new phases of development. This was the first monthly price increase in Victoria since April 2013.
New housing prices rose 0.3% in the CMAs of Hamilton and Edmonton. Builders in Hamilton attributed the rise to market conditions, while builders in Edmonton reported higher prices to offset the cost of new building code regulations. This was the largest monthly increase in Edmonton since May 2014 and followed three consecutive months of no change.
Vancouver recorded a 0.2% price increase in October, as builders reported higher prices because of market conditions and increased material and labour costs. New home prices in Vancouver have been rising steadily for five months.
Prices were unchanged in 10 of the 21 metropolitan areas surveyed.
New housing prices in Calgary were unchanged for the third consecutive month. Builders reported that price increases to cover the cost of new building code regulations were offset by lower negotiated selling prices.
The CMAs of Saskatoon (-0.5%) and St. Catharines–Niagara (-0.3%) recorded the largest price decreases in October. Builders in both CMAs reported lower negotiated selling prices as the primary reason for the decline. This was the second consecutive monthly decrease in both areas, and the largest in St. Catharines–Niagara since October 2014.
New Housing Price Index, 12-month change
he NHPI increased 1.5% over the 12-month period ending in October. This was the largest year-over-year increase at the national level since December 2014.
Chart 2: 12-month price changes in metropolitan regions across Canada

The combined metropolitan region of Toronto and Oshawa (+4.0%) was the top contributor, recording the largest 12-month price increase in October. This was the largest year-over-year gain in the region since January 2013.
Other notable increases were observed in Hamilton (+3.6%), Winnipeg (+1.6%), Vancouver (+1.6%), Kitchener–Cambridge–Waterloo (+1.2%) and London (+1.1%).
Among the 21 metropolitan areas surveyed, 7 posted year-over-year price declines in October: Regina (-1.6%), Saskatoon (-1.1%), Calgary (-0.6%), Québec (-0.6%), Victoria (-0.5%), Ottawa–Gatineau (-0.4%) and Charlottetown (-0.1%). This was the largest year-over-year decrease in Saskatoon since January 2010, and the smallest year-over-year decline in Victoria since August 2010.
Source: Statistics Canada, www.statcan.gc.ca/daily-quotidien/151210/dq151210b-eng.htm