New Housing Price Index, March 2016
May 16, 2016
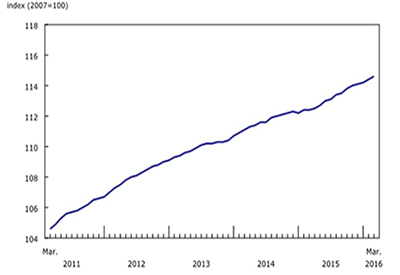
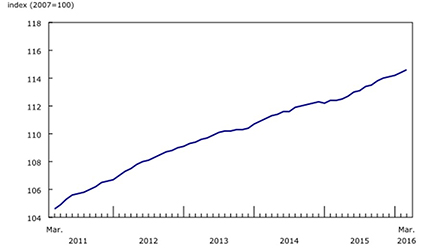
The New Housing Price Index (NHPI) rose 0.2% in March, following an identical increase in February. The index has increased for 12 consecutive months, largely driven by higher new housing prices in Ontario and British Columbia.
Chart 1
New Housing Price Index
Of the metropolitan areas covered by the index, the top contributors to the national increase in March were the combined region of Toronto and Oshawa (+0.4%) and Vancouver (+0.4%). Builders in both regions cited market conditions as the main reason for the advance.
London (+0.8%) recorded the largest monthly price gain in March. Builders reported higher material and labour costs as the primary reason for the increase—the largest since March 2010. New housing prices have risen in London for the past three months.
Other significant gains were observed in Windsor (+0.3%) and Winnipeg (+0.3%). Builders in Windsor reported higher material costs as the main reason for the rise. In Winnipeg, the price advance was mainly due to building code changes to improve the energy efficiency of new homes.
Prices were unchanged in 11 of 21 metropolitan areas surveyed. In Regina, higher material costs and increases due to market conditions were offset by lower negotiated selling prices. In Victoria, price gains due to current market conditions were also offset by lower negotiated selling prices.
New home prices fell in Saskatoon (-0.4%) and in St. John’s (-0.1%). Builders in both metropolitan areas reported lower negotiated selling prices as the main reason for the decreases. This marked the first decline for St. John’s in 10 months.
New Housing Price Index, 12-month change
The NHPI increased 2.0% over the 12-month period ending in March, the largest year-over-year increase at the national level since April 2013.
Chart 2
The combined metropolitan region of Toronto and Oshawa, and Vancouver post the highest year-over-year price increases
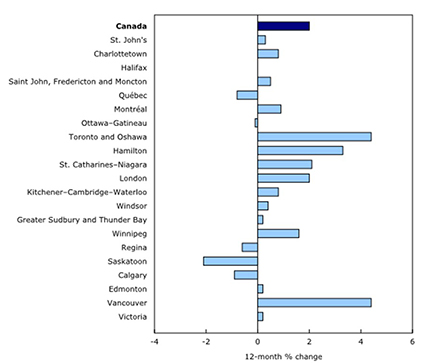
The combined metropolitan region of Toronto and Oshawa (+4.4%), along with Vancouver (+4.4%), led the year-over-year growth in March. This was the largest 12-month increase in Vancouver since August 2010.
Other notable increases were observed in Hamilton (+3.3%), St. Catharines–Niagara (+2.1%), London (+2.0%) and Windsor (+0.4%). This was the largest year-over-year gain in Windsor since January 2015.
Among the 21 metropolitan areas surveyed, 5 posted year-over-year price declines in March: Saskatoon (-2.1%), Calgary (-0.9%), Québec (-0.8%), Regina (-0.6%) and Ottawa–Gatineau (-0.1%).
Source: Statistics Canada; www.statcan.gc.ca/daily-quotidien/160512/dq160512c-eng.htm.