Labour Force Survey, October 2026
November 18, 2026
Employment was little changed in October (-4,700; 0.0%) and the employment rate fell 0.1 percentage points to 60.5%. The unemployment rate rose 0.2 percentage points to 6.7%.
The unemployment rate for youth aged 15 to 24 increased 0.7 percentage points to 13.7%. It also rose for people aged 55 and older (+0.2 percentage points to 5.5%). For those in the core age group (25 to 54 years old), the unemployment rate was unchanged for both men (5.8%) and women (5.3%).
Employment fell in wholesale and retail trade (-29,000; -1.0%), while there were increases in construction (+16,000; +0.9%) and educational services (+15,000; +1.0%).
Employment decreased in Alberta (-24,000; -0.9%) and Prince Edward Island (-1,300; -1.3%). On the other hand, it increased in British Columbia (+12,000; +0.4%) and Newfoundland and Labrador (+2,900; +1.2%).
Average hourly wages among employees rose 2.2% (+$0.83 to $37.89) on a year-over-year basis in October, following growth of 2.3% in September (not seasonally adjusted).
Employment little changed
Employment was little changed in October (-4,700; 0.0%). This follows declines in September (-68,000; -0.3%) and August (-42,000; -0.2%).
Chart 1
Employment rate decreases in October
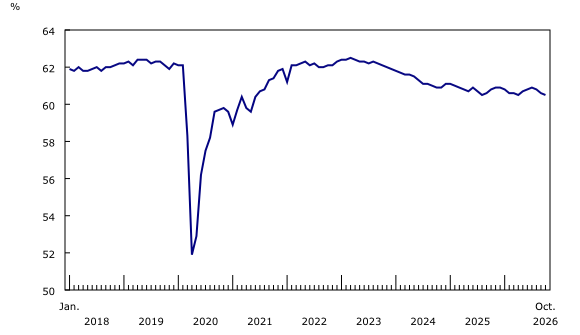
The employment rate—the percentage of the population aged 15 years and older who are employed—decreased 0.1 percentage points to 60.5% in October, marking a third consecutive monthly decline.
In the 12 months to October, employment recorded little net variation (+17,000; +0.1%) and the employment rate fell 0.3 percentage points.
The number of private sector employees fell by 53,000 (-0.4%) in October, the first decline since February. At the same time, the number of employees in the public sector rose by 50,000 (+1.1%) in October, following four consecutive monthly declines totalling 148,000 (-3.2%). On a year-over-year basis, the number of public sector employees was down by 70,000 (-1.5%) while the number of private sector employees was up slightly (+35,000; +0.3%). Self-employment was little changed in October and was up by 52,000 (+1.9%) compared with 12 months earlier.
Unemployment rate rises to 6.7%
The unemployment rate rose 0.2 percentage points to 6.7% in October, as more people searched for work (+33,000; +2.2%). This marked a second consecutive monthly increase in the unemployment rate. The unemployment rate in October was down 0.2 percentage points year over year and remained below the recent peak of 6.9% recorded in April 2026.
Chart 2
Unemployment rate rises to 6.7% in October

Just under one in five (18.9%) unemployed people in September had found work in October. This proportion—referred to as the job-finding rate—was slightly lower than 12 months earlier (19.8%), but well below the average for the same months from 2017 to 2019 (24.6%) (not seasonally adjusted).
The layoff rate in October (0.7%) was virtually unchanged compared with 12 months earlier (0.6%) (not seasonally adjusted). This represents the proportion of people who were employed in September but had become unemployed in October as a result of a layoff.
Among the 1.5 million people who were unemployed in October, nearly one-quarter (23.7%) were in long-term unemployment, meaning they had been continuously searching for work for 27 weeks or more. This was higher than the proportion recorded a year earlier (21.5%) and the average of 17.2% observed from 2017 to 2019, prior to the COVID-19 pandemic. The rate was highest among those aged 55 and older, reaching 32.7% in October 2026, up from 27.9% a year earlier. Among core-aged people, the proportion was 25.3%, up from 23.3% a year earlier. Youth continued to have the lowest proportion in long-term unemployment at 15.2%, little changed from a year earlier (14.4%).
Unemployment rate increases among youth
Infographic 1
Employment rate by age group, October 2026
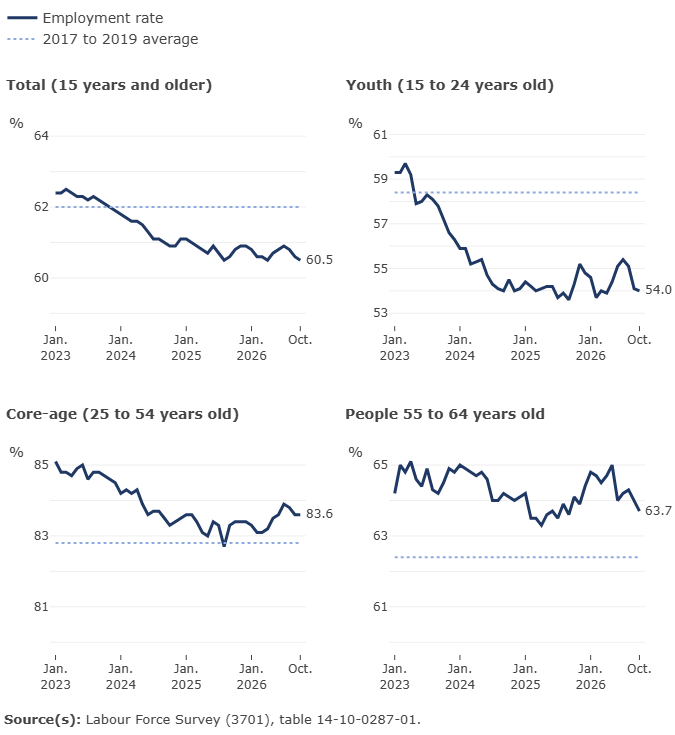
The unemployment rate among youth aged 15 to 24 rose 0.7 percentage points to 13.7% in October, as employment edged down and more youth searched for work. This follows three consecutive months of little variation in the youth unemployment rate. On a year-over-year basis, the unemployment rate for youth was little changed in October.
Among youth, the unemployment rate was higher for students (13.5%) than for those who were not attending school (12.3%) (not seasonally adjusted). These rates were little changed on a year-over-year basis. The proportion of youth who were attending school in October was 63.3%, up slightly compared with 12 months earlier (62.2%).
The employment rate among youth was 54.0% in October, little changed in the month and on a year-over-year basis.
Core-aged unemployment rate holds steady
Infographic 2
Unemployment rate by age group, October 2026

For those in the core age group (25 to 54 years old), the unemployment rate was unchanged for both men (5.8%) and women (5.3%) in October. For women, the rate was down compared with 12 months earlier (-0.4 percentage points) while for men it was little changed. Employment also held steady among core-aged men and women in October.
For people aged 55 and older, the unemployment rate rose 0.2 percentage points to 5.5% in October, as employment edged down (-14,000; -0.3%). On a year-over-year basis, the unemployment rate for people in this age group was little changed.
Fewer people working in wholesale and retail trade
Employment in wholesale and retail trade fell by 29,000 (-1.0%) in October. Employment in this industry has trended down in the 12 months to October (-113,000; -3.7%). Year-over-year declines were concentrated in Ontario, Quebec and British Columbia.
Chart 3
Employment change by industry, October 2026

Employment in construction increased by 16,000 (+0.9%) in October, following two consecutive months of little change. Compared with 12 months earlier, employment in construction was up by 47,000 (+2.9%).
Employment was up in educational services (+15,000; +1.0%) in October, partially offsetting the decline in September (-35,000; -2.2%). Compared with 12 months earlier, employment in this industry was down by 48,000 (-3.0%) in October.
Employment falls in Alberta, increases in British Columbia
Employment in Alberta fell by 24,000 (-0.9%) in October, offsetting a similar-sized increase in September (+23,000; +0.9%). On a year-over-year basis, employment in the province was up by 41,000 (+1.6%) in October. The unemployment rate in Alberta was 7.3%, up 0.9 percentage points in the month and little changed compared with 12 months earlier.
Map 1
Unemployment rate by province and territory, October 2026

On the other hand, employment in British Columbia increased by 12,000 (+0.4%) in October, after recording a decline in the previous month (-20,000; -0.7%). The unemployment rate in the province stood at 6.3% in October, little changed in the month and compared with 12 months earlier.
Employment in Quebec held steady in October, following a cumulative decline of 68,000 (-1.5%) in August and September. On a year-over-year basis, employment in Quebec was down by 106,000 (-2.3%) in October. The unemployment rate in the province fell 0.3 percentage points to 5.7% in the month, as fewer people searched for work. Despite the decline in October, the unemployment rate in Quebec was up 0.4 percentage points compared with 12 months earlier.
In Ontario, employment was little changed for a third consecutive month in October. The unemployment rate rose 0.3 percentage points to 7.3% in the month, as more people searched for work. On a year-over-year basis, employment in Ontario was little changed and the unemployment rate was down 0.3 percentage points.
In the spotlight: Share of Canadians living in households experiencing difficulties meeting their financial needs up for the first time since 2022
In October 2026, 29.7% of Canadians aged 15 and older lived in a household that had found it difficult to meet its financial needs in terms of transportation, housing, food, clothing and other necessary expenses over the previous four weeks. After recording a downward trend from October 2022 (35.5%) to October 2025 (27.7%), this proportion rose 2.0 percentage points in the 12 months ending in October 2026.
Infographic 3
Proportion of persons in households experiencing difficulties meeting their financial needs by census metropolitan area

Among Canada’s 15 largest census metropolitan areas (CMAs), the share of people living in households facing financial difficulties continued to be highest in CMAs in Southern Ontario, led by Oshawa (38.4%), Windsor (36.9%) and Hamilton (35.9%). All three CMAs had unemployment rates above the national average in October 2026. Conversely, the share was lowest in the CMA of Québec (15.7%).
Close to half (47.2%) of core-aged persons living in single parent households had experienced difficulties meeting their financial needs in the previous four weeks, notably higher than the corresponding shares among couples with children (33.0%) and couples without children (27.3%). In the 12 months to October 2026, the share experiencing difficulties varied little among single parent households and couples with children, while it increased among couples without children (+2.0 percentage points).
In the spotlight: 6 in 10 workers report being very satisfied with their job
In addition to household financial security, job satisfaction is an important indicator of Quality of Life. Job satisfaction can reflect pay and benefits, working conditions and other factors, such as the alignment of a person’s job with their education, skills and experience.
In October 2026, the Labour Force Survey (LFS) asked employed Canadians aged 15 to 69 to rate their level of job satisfaction on a scale of 0 to 10. Just over 6 in 10 workers (60.9%) reported that they were very satisfied with their job; that is, they rated their job satisfaction 8, 9 or 10 out of 10. This proportion has been stable in recent years but remains slightly lower than in 2023 (62.2%), when labour market conditions were generally more favourable.
Job satisfaction tends to increase as workers progress through their careers. In October 2026, the proportion who were very satisfied with their job was lowest among workers aged 15 to 24 (57.5%) and 25 to 34 (57.4%), while it was highest among workers aged 55 to 69 (68.9%).
Workers in natural resources, agriculture and related production occupations (68.5%) and management occupations (67.4%) were the most likely to report that they were very satisfied with their job. Conversely, those employed in sales and service occupations were the least likely to report that they were very satisfied with their job (54.3%). Workers in this broad occupational group also had the lowest average hourly wage ($24.19) of any broad occupational group.