Gross Domestic Product by Industry: Provinces and Territories, 2013
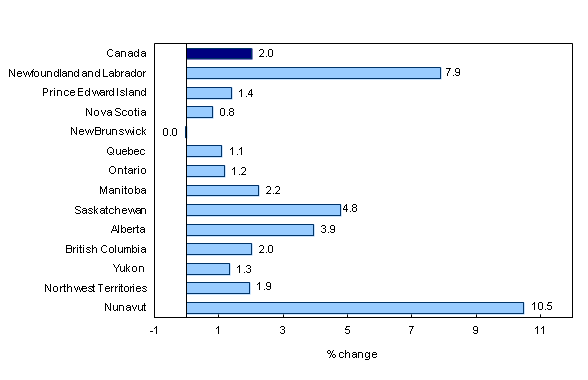
Real gross domestic product (GDP) by industry increased in all provinces and territories in 2013 except New Brunswick, where it remained unchanged. Nationally, real GDP by industry expanded 2.0% in 2013 after increasing 1.8% in 2012. Newfoundland and Labrador led all provinces in GDP growth. Saskatchewan, Alberta, Manitoba and Nunavut also surpassed the national growth rate. Ontario and Quebec were below the national average.
Chart 1: Real gross domestic product, 2013
Atlantic provinces
In Newfoundland and Labrador, GDP increased 7.9%, leading all provinces in 2013, following a 4.2% decline in 2012. Growth was mainly attributable to significantly higher engineering construction and a rebound in mining, quarrying and oil and gas extraction. Services output rose 0.6% with gains in retail trade, finance and insurance as well as accommodation and food services. Most major industries in the public sector (public administration, health care and social assistance, and education) recorded decreases. Manufacturing output fell 1.9%, as the decline in non-durable goods manufacturing more than offset the increase in durable goods manufacturing.
In Prince Edward Island, GDP expanded 1.4% in 2013, matching the growth in 2012. Manufacturing output rose 6.3%, led by increases in chemicals (which include pharmaceuticals), fabricated metal and food products. Fishing industry output advanced 6.0% and crop production increased 2.5%. Services output increased 1.2%, mostly on gains in finance and insurance as well as accommodation and food services. Construction fell 3.6% as a result of lower non-residential building and electric power engineering construction.
Nova Scotia’s GDP grew 0.8% in 2013, after no growth in 2012. Construction rose 4.9% despite a decrease in electric power and oil and gas engineering construction. Electric power generation, transmission and distribution rose 6.0%. Mining, quarrying, and oil and gas extraction advanced 2.3%, as a result of higher output of non-metallic mineral mining and support activities for mining. Manufacturing output fell 2.1% as 14 of 19 subsectors declined. However, manufacturing of transportation equipment increased 6.9%.
Services output increased 0.7%. Gains in finance and insurance, real estate leasing, retail trade and hospitals services more than offset declines in federal government public administration, defence services, wholesale trade, as well as administration and support services. Output of real estate agents and brokers fell as activity in the home resale market declined.
In New Brunswick, GDP was unchanged in 2013 following a 1.0% decline in 2012. The output of goods-producing industries fell 1.9%. Mining and quarrying declined 22%, mainly as a result of a mine closure. Construction fell 16% with the completion of major transportation and electric power engineering projects. Manufacturing output increased 2.8% with notable gains in wood and non-metallic mineral products (except cement and concrete products). Electric power generation, transmission and distribution increased 31% with the restart of a nuclear power station.
Services output rose 0.6% in New Brunswick. Higher activity in wholesale and retail trade and depository credit intermediation outweighed declines in federal government public administration, defence services and administrative and support services.
Central Canada
Quebec’s GDP grew 1.1% in 2013, after a 1.5% increase in 2012. The output of service industries rose 1.6%, with increases in retail trade, banking and other depository credit intermediation services as well as in universities and colleges and CEGEPs. Federal government public administration and defence services declined.
While the overall output of goods-producing industries decreased 0.2% in Quebec, notable variations were recorded among the major industrial sectors. Metal ore mining increased 13% and output of electric power generation, transmission and distribution rose 5.1%. Non-residential building construction increased 11%, owing in part to continued work on institutional facilities. Electric power engineering construction rose 5.8%. Residential construction fell 4.6%. Manufacturing output fell 1.5% as 14 of 19 subsectors declined. However, manufacturing of primary metals and of wood products increased significantly.
In Ontario, GDP advanced 1.2% in 2013, following a 1.4% increase in 2012. Services output rose 2.0% with increases in retail trade, finance and insurance, education, real estate leasing, professional, scientific and technical services, and accommodation and food services. Higher output of local, municipal and regional public administration services was offset by a decline in federal government public administration and defence services.
Goods production fell 1.5% in Ontario, as decreases in construction and manufacturing outweighed increases in metal ore mining and electric power generation, transmission and distribution. Construction decreased 4.0%, with declines in residential, non-residential buildings and engineering work. Manufacturing output fell 2.3% as computer and electronic products, motor vehicle and motor vehicle parts, machinery, and iron and steel mills and ferro-alloy products all declined.
Western provinces
Manitoba’s GDP grew 2.2% in 2013, after increasing 2.9% in 2012. Crop production increased 26%, owing to very favourable growing conditions. Construction increased 3.6% with contributions from non-residential and residential building construction as well as electric power engineering work. Utilities rose 8.5% as the demand for electricity increased. Manufacturing output decreased 0.2%, with declines in meat products and fabricated metal products more than offsetting higher manufacturing of agricultural, construction and mining machinery.
Services output increased 2.2%, led by finance and insurance, education, retail trade, as well as other business and personal services. Provincial, local, municipal and regional public administration increased while federal government public administration, defence services and aboriginal public administration declined. Support activities for oil and gas extraction fell significantly.
In Saskatchewan, GDP rose 4.8% in 2013 following a 2.2% increase in 2012. Output of goods-producing industries increased 6.6% and services industries grew 3.0%. Crop production increased 38%, the result of a bumper wheat crop and a record canola crop. Strong export demand led to higher output of non-metallic mineral mining (which includes potash) in the first half of the year. Manufacturing output increased 3.4% with gains in chemical, food and wood products. Wholesale trade and transportation services rose in parallel with increased production in goods producing industries.
Strong employment and population growth in Saskatchewan stimulated demand for retail trade, finance and insurance services, accommodation and food services, and residential building construction. Engineering construction fell 7.1%, despite a significant increase in electric power engineering construction.
Following growth of 3.7% in 2012, Alberta’s GDP rose 3.9% in 2013 as 19 of 20 major industry groups increased production. Oil and gas extraction advanced 3.9% and support activities for mining also increased. Crop production grew 21%, aided by very favourable growing conditions.
Construction advanced 7.0%, led by electric power and oil and gas engineering projects. Residential building construction increased 8.2%, partly as a result of both strong population growth and rebuilding efforts in response to flooding in southern areas of Alberta. Manufacturing output increased 1.1%. Advances in chemical and wood products were partly offset by declines in primary and fabricated metal products. Wholesale trade and transportation services increased in tandem with goods production.
Services output grew 3.4% in Alberta with increases in retail trade, finance and insurance, real estate and rental and leasing, education, as well as health care and social assistance.
In BC, GDP increased 2.0% in 2013, after growing 1.8% in 2012. Goods production rose 1.2%. Copper, nickel, lead and zinc ore mining increased 21%, coal mining advanced 7.7% and oil and gas engineering construction increased 9.7%. Higher export demand led to gains in forestry and logging, wood products manufacturing and related wholesaling. Manufacturing output was down 0.2%, as decreases in food, cement and concrete products as well as transportation equipment outweighed increases in architectural and structural products and other electronic products. Electric power generation, transmission and distribution fell 3.4%.
The output of service industries rose 2.2% in BC, with increases in banking and other depository credit intermediation, accommodation and food services, financial investment services, offices of real estate agents and brokers and universities. Federal government public administration and defence services declined.
The territories
In Yukon, GDP grew 1.3% in 2013 following a 3.3% advance in 2012. Mining, quarrying, and oil and gas extraction rose 8.0%. Support activities for mining (including exploration) declined, owing in part to weak metal prices. Construction decreased 2.5%, as residential and non-residential building construction declined. Output of territorial public administration increased while federal government public administration and defence services fell. Manufacturing, wholesale and retail trade declined.
In Northwest Territories, GDP grew 1.9% in 2013, following the same increase in 2012. Diamond mining advanced 6.0%. Construction grew 28% with increases in engineering and residential building and non-residential building construction. Oil and gas extraction declined 13%. The output of territorial public administration services increased while federal government public administration and defence services declined. Both wholesale and retail trade were down.
In Nunavut, GDP grew 10.5% in 2013, after a 1.8% gain in 2012. Both non-residential building and engineering construction increased significantly. Mining, quarrying and oil and gas extraction including support activities rose 16%. Wholesale trade and manufacturing increased together with construction. Most public sector industries, such as education, health care and social assistance as well as territorial and local, municipal and regional public administration services increased.
Source: Statistics Canada