Building Permits, March 2025
May 14, 2025
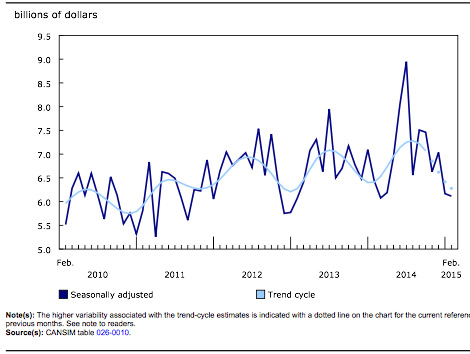
In March, the total value of building permits issued in Canada decreased by $549.4 million (-4.1%) to $12.9 billion. The decrease was led by the non-residential sector (-$716.3 million), and it was tempered by the residential sector (+$166.9 million).
On a constant dollar basis (2017=100), the total value of building permits issued in March decreased 5.1% from the previous month and was up 11.1% on a year-over-year basis.
Chart 1
Total value of building permits, seasonally adjusted

Infographic 1
Building permits, March 2025

Commercial construction intentions drive the fall in the non-residential sector
The value of non-residential building permits decreased by $716.3 million to $4.2 billion in March, marking a 14.5% decline from the previous month. Commercial construction intentions led the decline, dropping $474.1 million (-19.0%) to $2.0 billion in March. Meanwhile, the institutional component (-$238.5 million; -14.4%) also saw a decrease. The industrial component (-$3.7 million; -0.5%) experienced a minor decline, continuing its downward trend seen since October 2024.
The reduction in commercial construction intentions in March 2025 was most pronounced in Ontario (-$268.6 million), and it was supported by declines in British Columbia (-$187.1 million), three additional provinces and two territories. Concurrently, Saskatchewan (-$293.7 million) drove the institutional component decrease; this component rose in February, driven by a building permit being issued for a hospital.
Losses in the institutional component in March were partially offset by a gain in Ontario (+$121.1 million), supported by construction intentions for long-term care facilities and day care centres in the province. The loss in the industrial component was driven by Alberta (-$152.4 million); there were additional decreases in six provinces and one territory. Ontario’s increase of $177.2 million helped mitigate the overall decline.
Chart 2
Value of building permits for the single-family and multi-family components

Chart 3
Value of building permits for the residential and non-residential sectors

Chart 4
Value of building permits for the industrial, commercial and institutional components

Single-family permits slow residential sector growth
Residential construction intentions in Canada increased $166.9 million (+2.0%) in March to reach $8.7 billion. A gain in the multi-family component (+$322.5 million to $5.9 billion) was partially offset by a decline in the single-family component (-$155.6 million to $2.8 billion).
The rise in the multi-family component in March was particularly strong in British Columbia (+$397.8 million), driven by the Vancouver census metropolitan area (CMA) (+$652.3 million).
Meanwhile, the single-family component decrease was primarily observed in Ontario (-$185.7 million) and was supported by Quebec (-$26.0 million).
Overall, 22,800 multi-family dwellings and 4,400 single-family dwellings were authorized for construction in March, representing a 4.6% increase from the previous month.
Quarterly review: British Columbia leads gains in the first quarter
The total value of building permits in the first quarter was $39.1 billion, up 2.9% from the previous quarter ($38.0 billion), a fifth consecutive quarterly increase. British Columbia (+$1.7 billion) led the growth in construction intentions.
The residential sector grew $1.5 billion (+5.9%) to $25.9 billion in the first quarter, fuelled by a gain in the multi-family component (+$1.5 billion; +9.6%) to reach a record high of $17.3 billion. The gain in multi-family construction intentions was concentrated in British Columbia (+$1.2 billion), driven by broad-based growth in the Vancouver CMA.
Meanwhile, single-family construction intentions edged down $55.0 million (-0.6%) to $8.6 billion, with Alberta (-$75.2 million) and Ontario (-$64.1 million) leading the decline. Nova Scotia (+$34.7 million) tempered these losses, along with five other provinces and one territory.
Non-residential construction intentions declined by $354.1 million (-2.6%) to $13.2 billion in the first quarter, a second consecutive quarterly decline. Decreases in the industrial (-$884.5 million) and institutional (-$60.7 million) components were tempered by a gain in the commercial component (+$591.1 million).