Labour Force Survey, March 2026
April 15, 2026
Employment was little changed in March (+14,000; +0.1%) and the employment rate held steady at 60.6%. The unemployment rate was unchanged at 6.7%.
Across the major age groups, employment held steady and the unemployment rate was little changed.
Employment rose in the ‘other services’ industry (+15,000; +1.9%), which includes personal and repair services, and it also increased in natural resources (+10,000; +3.0%). Employment declined in finance, insurance, real estate, rental, and leasing (-11,000; -0.8%).
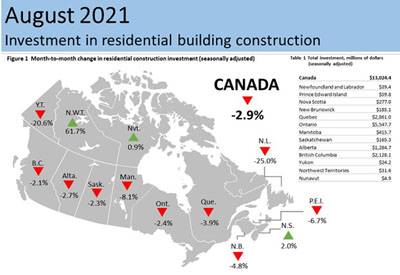
Fewer people were employed in British Columbia (-19,000; -0.7%), while employment rose in Manitoba (+11,000; +1.5%), Saskatchewan (+5,800; +0.9%) and Nova Scotia (+3,900; +0.7%).
Average hourly wages among employees increased 4.7% (+$1.68 to $37.73) on a year-over-year basis in March, following growth of 3.9% in February (not seasonally adjusted).
Employment held steady in March
Employment was little changed in March (+14,000; +0.1%) following a cumulative decline of 109,000 (-0.5%) over the first two months of 2026. The number of full-time and part-time workers both showed little variation in March.
Chart 1
Employment rate holds steady in March

On a year-over-year basis, employment was up by 87,000 (+0.4%) in March, largely reflecting gains over the final four months of 2025.
The employment rate—the proportion of the population aged 15 and older who are employed—was unchanged at 60.6% in March, following a cumulative decline of 0.3 percentage points in January and February. The employment rate in March was just above the recent low of 60.5% recorded in August 2025 and was down 0.3 percentage points year over year.
Infographic 1
Employment rate by age group, March 2026

In March, there was little variation in the number of public and private sector employees as well as in the number of self-employed workers. On a year-over-year basis, the number of employees grew at a faster pace in the public sector (+1.2%) than in the private sector (+0.6%).
Unemployment rate unchanged at 6.7%
The unemployment rate was unchanged in March at 6.7%, following a 0.2 percentage point increase in February. The unemployment rate was below the peak of 7.1% recorded in August and September 2025, and was little changed on a year-over-year basis. In comparison, the unemployment rate averaged 6.0% from 2017 to 2019, prior to the COVID-19 pandemic.
Chart 2
Unemployment rate unchanged at 6.7% in March

The layoff rate—representing the proportion of people who were employed in February but had become unemployed in March as a result of a layoff—was 0.6%, comparable with the corresponding proportion from 12 months earlier (0.7%) and with the pre-pandemic average (0.7%) for the corresponding months from 2017 to 2019 (not seasonally adjusted).
Among people who were unemployed in February, 15.2% found work in March. This was similar to the rate recorded in the same months in 2025 (14.7%) but was below the pre-pandemic average of 19.1% for the same months from 2017 to 2019 (not seasonally adjusted). This indicates that higher unemployment rates relative to the pre-pandemic period continue to be mostly driven by slower hirings, rather than by increased layoffs.
The participation rate—the proportion of the population aged 15 and older who were employed or looking for work—was unchanged at 64.9%. On a year-over-year basis, the labour force participation rate was down 0.4 percentage points.
Unemployment rate varies little among major demographic groups
Among people in the core working age of 25 to 54 years old, the unemployment rate was virtually unchanged at 5.8% for both men and women in March. On a year-over-year basis, the unemployment rate was up 0.3 percentage points for core-aged women but was little changed for core-aged men.
Infographic 2
Unemployment rate by age group, March 2026

Among youth aged 15 to 24, the unemployment rate was little changed at 13.8% in March, following an increase of 1.3 percentage points in February. The youth unemployment rate in March was below the recent high of 14.6% recorded in September 2025 and was little changed on a year-over-year basis.
The unemployment rate for people aged 55 years and older was 4.9% in March, unchanged in the month and down 0.3 percentage points from the same month a year earlier.
Year-over-year growth in average hourly wages accelerates
Average hourly wages among employees were up 4.7% on a year-over-year basis in March, the highest growth rate since October 2024 (not seasonally adjusted). Year-over-year growth in average hourly wages had previously hovered between 3.2% and 3.9% from January 2025 to February 2026.
Across age groups, year-over-year hourly wage growth in March was highest among employees aged 55 and older (+5.2%) and lowest among young employees aged 15 to 24 (+1.8%). Among core-aged (25 to 54 years old) employees, the average hourly wage was up 4.5% over this period.
Recent increases in average hourly wages were partly due to a shift in the composition of employment. Using a method that holds constant the composition of employees by occupation and job tenure, average hourly wages grew by 3.6% on a year-over-year basis in March, similar to the rate of growth observed in January (+3.6%) and February 2025 (+3.5%).
Employment rises in ‘other services’ and natural resources
Employment rose in ‘other services’ (+15,000; +1.9%) in March, offsetting a similar-sized decline in February. Employment in this industry, which includes repair and maintenance services, was little changed compared with 12 months earlier.
Chart 3
Employment change by industry, March 2026

Employment also increased in natural resources (+10,000; +3.0%), with nearly half of those gains coming from Alberta (+4,500; +3.2%). On a year-over-year basis, employment in this industry was little changed at the national level and in Alberta.
On the other hand, employment fell in finance, insurance, real estate, rental and leasing (-11,000; -0.8%) in March, the first significant monthly decline since November 2023.
Although employment in health care and social assistance was little changed in March, it was up 94,000 (+3.3%) compared with 12 months earlier, the largest employment growth among industries. Over that same period, the largest employment decline among industries was in manufacturing (-44,000; -2.4%).
Employment down in British Columbia, up in Manitoba, Saskatchewan and Nova Scotia
Employment in British Columbia fell by 19,000 (-0.7%) in March, following a similar-sized decline (-20,000; -0.7%) in February. The unemployment rate in British Columbia rose 0.6 percentage points to reach 6.7% in March, matching the national average but the highest level for the province since February 2016 (excluding 2020 and 2021).
Map 1
Unemployment rate by province and territory, March 2026

On the other hand, employment increased in Manitoba (+11,000; +1.5%) and in Saskatchewan (+5,800; +0.9%) in March, following declines in both provinces in February. The unemployment rate held steady in Manitoba at 5.6% in March. Saskatchewan had the lowest unemployment rate among the provinces at 5.0%, down 0.6 percentage points in March. Employment also rose in Nova Scotia (+3,900; +0.7%) in March and the unemployment rate in the province fell 0.5 percentage points to 6.6%.
In Ontario, employment held steady for the second consecutive month, after declining by 67,000 (-0.8%) in January. The unemployment rate in the province was unchanged at 7.6% in March. Regions of Southern Ontario continued to experience challenging labour market conditions and elevated unemployment rates, in a context that includes ongoing economic uncertainty related to tariffs on exports to the United States. Among Canada’s 20 largest census metropolitan areas (CMAs), the 5 highest unemployment rates in March were in London (9.1%), Kitchener–Cambridge–Waterloo (8.6%), Windsor (8.5%), Barrie (8.5%) and Toronto (8.1%) (three-month moving averages).
Infographic 3
Unemployment rates by census metropolitan area (CMA)

Employment also held steady in Quebec, following a decline of 57,000 (-1.2%) in February. The unemployment rate fell 0.5 percentage points to 5.4% in Quebec in March, as fewer people searched for work. In the Montréal CMA, the unemployment rate was unchanged at 6.6% in March, while in the CMA of Québec, it stood at 2.6%—the lowest rate among Canada’s 20 largest CMAs (three-month moving averages).