Residential Sector Breaks Two-Month Dip, Advanced by Multi-Dwelling Building Permits
April 19, 2023
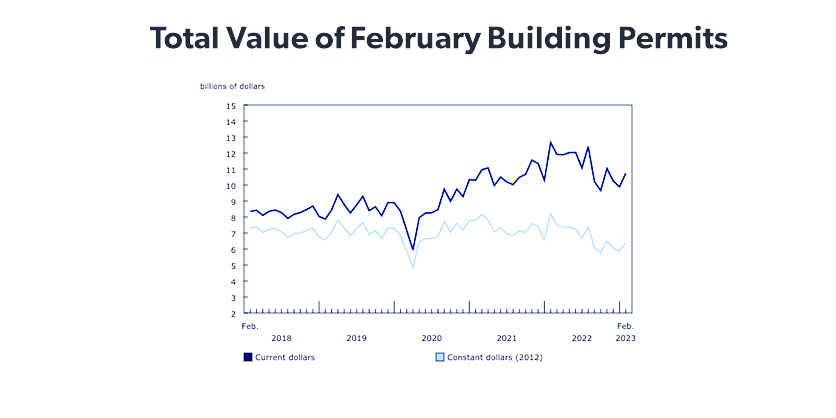
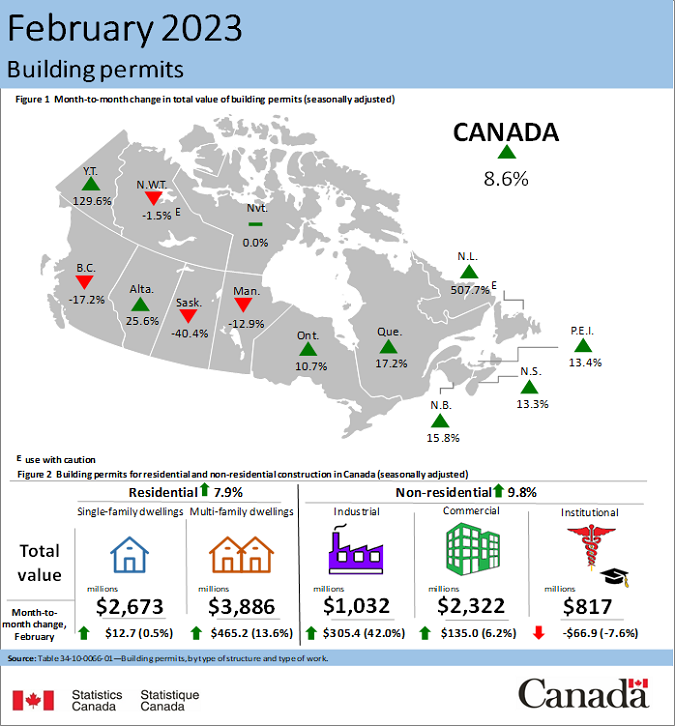
The total value of building permits in Canada advanced 8.6% to $10.7 billion in February, indicating robust intentions for both the residential (+7.9% to $6.6 billion) and non-residential (+9.8% to $4.2 billion) sectors.
Seven provinces reported monthly increases, with notable gains in Ontario (+10.7%) and Alberta (+25.6%).
On a constant dollar basis (2012=100), the total value of building permits went up 8.2% to $6.4 billion.
Residential sector breaks two-month dip, advanced by multi-dwelling building permits
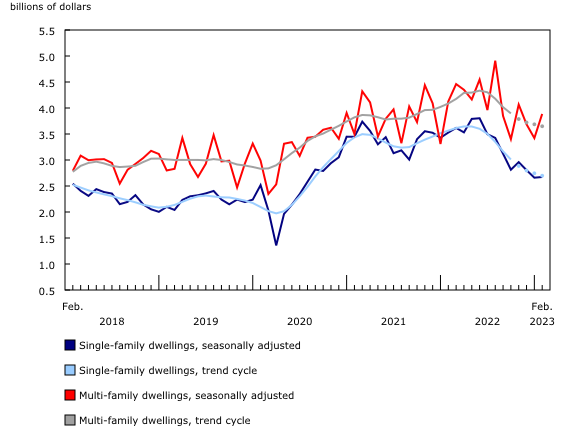
The multi-dwelling component sharply increased by 13.6%, led by a variety of large value permits in Ontario (+25.4%).
Meanwhile, construction intentions in single-family homes remained stable (+0.5%).
Overall, permits gained 7.9% to $6.6 billion. Permits were issued for 22,900 new units nationally, 3,600 more than the intentions reported in January.
All four eastern provinces saw gains in the value of permits, collectively advancing 25.7% month over month. Conversely, British Columbia (-13.4%), Alberta (-3.9%) and Saskatchewan (-40.6%) reported monthly declines in residential permits.
Alberta bolsters non-residential growth
The total monthly value of non-residential permits increased 9.8% to $4.2 billion, the highest non-residential value since February 2022. Much of this gain is attributable to several high-value projects in Alberta.
Across the country, gains in the industrial (+42.0%) and commercial (+6.2%) components more than offset losses in the institutional (-7.6%) component.
To explore data using an interactive user interface, visit the Building permits: Interactive Dashboard.
For more information on construction, please visit the Construction statistics portal.
For more information on housing, please visit the Housing statistics portal.
Statistics Canada has a Housing Market Indicators dashboard. This web application provides access to key housing market indicators for Canada, by province and by census metropolitan area. The indicators are updated automatically with new information from monthly releases, giving users access to the latest data.
Go HERE for more information