Multifactor Productivity Growth in 2016: 0.1% Increase YOY
Apr 17, 2018
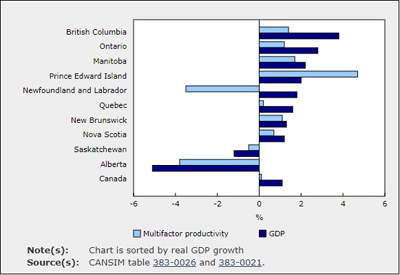
Multifactor productivity growth in the business sector varied substantially across provinces in 2016. It was highest in Prince Edward Island (+4.7%) and lowest in the three oil producing provinces, led by Alberta (-3.8%) and followed by Newfoundland and Labrador (-3.5%) and Saskatchewan (-0.5%). For Canada overall, multifactor productivity increased by 0.1% in 2016 following a 1.0% decline in 2015 and 1.4% increase in 2014.
Multifactor productivity growth in the business sector varied substantially across provinces in 2016. It was highest in Prince Edward Island (+4.7%) and lowest in the three oil producing provinces, led by Alberta (-3.8%) and followed by Newfoundland and Labrador (-3.5%) and Saskatchewan (-0.5%). For Canada overall, multifactor productivity increased by 0.1% in 2016 following a 1.0% decline in 2015 and 1.4% increase in 2014.Multifactor productivity measures the extent to which inputs are efficiently used in the production process. Growth in this area is often associated with technological change, organizational change and economies of scale.
In 2016, the pattern of multifactor productivity growth across provinces generally mirrored that of real gross domestic product (GDP) growth with the exception of Newfoundland and Labrador.
Real GDP growth equalled or exceeded 2% in four provinces in 2016, led British Columbia (+3.8%), and followed by Ontario (+2.8%), Manitoba (+2.2%) and Prince Edward Island (+2.0%). These four provinces also posted relatively strong growth in multifactor productivity, led by Prince Edward Island (+4.7%), and followed by Manitoba (+1.7%), British Columbia (+1.4%) and Ontario (+1.2%).
Real GDP declined in two western oil-producing provinces in 2016, falling by 5.1% in Alberta and 1.2% in Saskatchewan. These two provinces also saw a decline in multifactor productivity in 2016.
For Newfoundland and Labrador, real GDP growth (+1.8%) was accompanied by even stronger increases in combined capital and labour inputs (+5.6%) in 2016. Multifactor productivity growth, measured as the difference in real GDP growth and the growth of combined capital and labour inputs was negative 3.5% in 2016.
In Canada, multifactor productivity growth slowed in 2015 and 2016, following robust growth the previous four years. From 2010 to 2014, multifactor productivity increased by 0.8% per year in the Canadian business sector.
The slowing of multifactor productivity growth between the two periods was largely attributable to lower multifactor productivity growth in Alberta, which fell from a 1.3% increase per year on average from 2011 to 2014 to a 4.8% decline on average per year in 2015 and 2016.
The relatively strong multifactor productivity growth in Canada from 2011 to 2014 reflected stronger growth in British Columbia (+1.5% per year on average), Alberta (+1.3%) and Ontario (+0.9%).
Source: Statistics Canada, www.statcan.gc.ca/daily-quotidien/180409/dq180409b-eng.htm