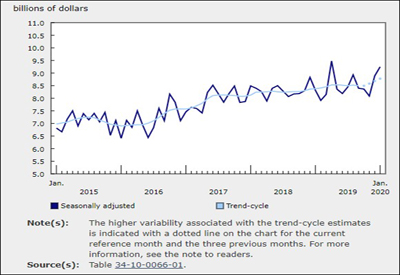
Value of Canadian Building Permits Rose 4% in January
Mar 11, 2020
The total value of building permits issued by Canadian municipalities increased 4.0% to $9.2 billion in January. Increases were reported in six provinces, led by British Columbia (+52.1% to $2.2 billion).
Change in Vancouver’s development costs drives growth in British Columbia and nationally
The majority of January’s national increase in the value of building permits was in British Columbia (+$751 million), largely due to the census metropolitan area (CMA) of Vancouver. The value of permits increased in the CMA of Vancouver by 81.8%, prior to increases in development fees, which came into effect on January 15. Meanwhile, Quebec (-$366 million) and Ontario (-$161 million) reported the largest provincial declines after strong activity in December 2019.
Value of residential permits up for multi- and single-family dwellings
The residential sector reported strong gains in January, increasing 12.7% from December 2019 to $5.8 billion. Permits for multi-family dwellings were up 17.1% to $3.4 billion in January, largely due to multiple projects in the CMA of Vancouver.
The total value of permits for single-family dwellings increased 7.0% to $2.4 billion, mainly due to housing developments in Ontario (+$105 million) and Quebec (+$48 million). The CMA of Brantford reported the largest increase in the value of permits for single-family dwellings (+340.9% to $41 million), a record high for the CMA.
Non-residential sector down due to institutional permits
The value of non-residential permits was down 7.8% to $3.5 billion in January. This decrease was largely due to a decline in the total value of institutional permits (-30.5% to $732 million) following strong gains in December 2019.
Despite increases in seven provinces, the value of commercial permits decreased 0.8% to $2.1 billion, with Quebec reporting the largest decline (-$249 million).
The value of industrial permits offset some of the non-residential decline, rising 6.8% to $682 million, led by Ontario (+$90 million).
Source: Statistics Canada, www150.statcan.gc.ca/n1/daily-quotidien/200309/dq200309a-eng.htm