Ontario Drives 0.3% Increase in August New Housing Price Index
The combined region of Toronto and Oshawa was the top contributor to the overall 0.3% increase in August, with prices up 0.6% over the previous month. Builders reported market conditions as the main reason for the gain. This marks the seventh straight month of price increases in that region. Prices remained unchanged in 8 of the 21 metropolitan areas surveyed. Year over year, the New Housing Price Index (NHPI) rose 1.3% in August, following identical increases in June and July.
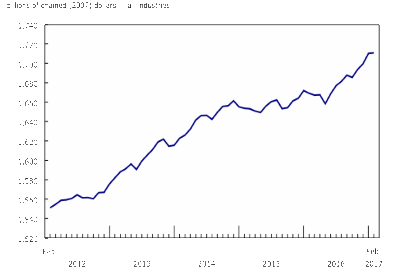
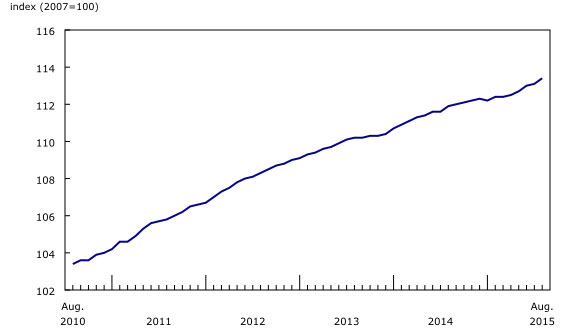
Chart 1: New Housing Price Index
The census metropolitan area (CMA) of Hamilton recorded the largest price increase in August, up 0.8%. Builders cited market conditions as the primary reason for the advance, the largest in that CMA since April 2013. Prices in Hamilton have been rising for four consecutive months.
Prices rose 0.7% in the CMA of St. Catharines-Niagara, following a 0.1% decrease the previous month. Builders reported higher material and labour costs and higher list prices as the main reasons for the increase — the largest in that CMA since February 2014.
New housing prices rose 0.2% in the CMAs of Montreal and London. According to builders, market conditions attributed to the rise in Montreal, while builders in London reported higher construction costs.
The CMAs of Quebec and Regina recorded the largest price decreases in August as both fell 0.2%. Builders in the CMA of Quebec cited market conditions as the main reason for the decline. Builders in Regina reported lowered prices to stimulate sales.
New home prices declined 0.1% in both Charlottetown and Victoria. Builders in Charlottetown lowered prices to encourage sales. In the CMA of Victoria, higher list prices were offset by lower negotiated selling prices. The decrease in Victoria follows three consecutive months of no price change.
Chart 2: Year over year price increases by municipality

Hamilton as well as Toronto and Oshawa post the largest year-over-year price increases.
The combined metropolitan region of Toronto and Oshawa was the top contributor to the increase in August, with prices up 3.8% over the same month a year earlier. This was the largest year-over-year increase in that CMA since January 2013.
The CMA of Hamilton also recorded a 3.8% year-over-year increase — the largest in that CMA since March 2008.
Other notable increases were observed in Kitchener-Cambridge-Waterloo (+1.6%), London (+1.5%) and Vancouver (+1.4%).
The combined metropolitan region of Saint John, Fredericton and Moncton recorded a 0.2% increase in August, the first annual increase in that CMA since May 2014.
Among the 21 metropolitan areas surveyed, 5 posted year-over-year price declines in August: Regina (-1.8%), Victoria (-1.6%), Ottawa–Gatineau (-1.0%), Québec (-0.6%) and Calgary (-0.2%). This was the first annual decline in Calgary since January 2012.
Source: Statistics Canada, http://www.statcan.gc.ca/daily-quotidien/151008/dq151008a-eng.htm?cmp=mstatcan.