Monthly Survey of Manufacturing, August 2021
Oct 17, 2021
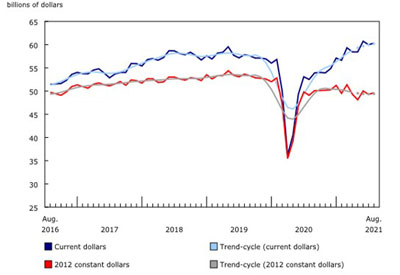
Following a 1.2% decline in July, manufacturing sales increased 0.5% to $60.3 billion in August, on higher sales of petroleum and coal (+7.3%), chemicals (+6.3) and primary metals (+3.3%). Sales of wood products (-17.1%), motor vehicles (-8.7%) and motor vehicle parts (-10.5%) declined the most. On a year-over-year basis, total sales were up 14.9% in August.
Sales in constant dollars increased 0.6% in August, indicating that the monthly gain resulted entirely from higher sales volume. The Industrial Product Price Index decreased 0.3% month over month, while the Raw Materials Price Index decreased 2.4%, the first decline since September 2020.
Petroleum sales reach highest level in over two years
Petroleum product sales rose 7.3% to $6.6 billion in August, the third consecutive increase and the highest level since May 2019. Higher prices and volumes sold contributed to the gain. Sales in constant dollars rose 4.3%. Exports of refined petroleum energy products rose 5.6% in August, partially on higher demand from the United States.
Sales of chemicals rose 6.3% to a record high of $5.4 billion in August. Excluding basic chemical manufacturing, sales of all other chemical manufacturing were up in August, led by resin, synthetic rubber, and artificial and synthetic fibres and filaments. Sales of chemicals on a constant dollar basis were up 4.8%, while prices for chemicals and chemical products increased 1.4% from the previous month.
Sales of primary metals rose 3.3% to a record high $5.8 billion in August. Sales in this industry have been rising since May 2020 on increased demand and higher prices, especially for iron and steel mills and ferro-alloy manufacturing which rose 7.0% in August. On a year-over-year basis, sales of primary metal products have rebounded 55.2%. Meanwhile, exports of metal and non-mineral products increased 4.0%.
Production of aerospace products (+6.3%) and sales of furniture and related product (+7.1%) and fabricated metal products (+2.0%) also rose in August.
Wood product sales fell 17.1% to $3.3 billion in August, mainly driven by lower prices for softwood lumber. Sales in constant dollars were down 3.7%, while prices for lumber and other wood products declined 14.2%. The total value of building permits in Canada decreased 2.1% in August, while exports of forestry products and building materials fell 7.9%. Despite the decline, sales of wood products were up 6.8% year over year.
Following three consecutive gains, motor vehicle sales decreased 8.7% to $3.0 billion in August, due to the ongoing shortage of semiconductor chips. Motor vehicle sales were down 34.1% year over year in August, while sales of motor vehicle parts fell 21.2%. Additionally, exports of motor vehicles and parts decreased 7.3%.
Widespread gains in Quebec
Manufacturing sales increased in five provinces in August, led by Quebec and Ontario, while sales in British Columbia declined the most.
Sales in Quebec increased 2.6% to $15.5 billion in August, driven by higher sales in 17 of 21 industries, led by transportation equipment (+8.3%), petroleum and coal (+6.7%) and fabricated metal products (+4.7%). The increase in transportation equipment was mostly attributable to higher production of aerospace products and parts (+12.1%).
In Ontario, sales rose 0.4% to $26.0 billion in August, on higher sales of chemicals (+18.7%), primary metals (+6.2%) and petroleum (+9.1%). These gains were partially offset by lower sales of motor vehicles (-9.5%) and motor vehicle parts (-10.8%). On a year-over-year basis, total sales in Ontario were up 4.7%.
Sales in British Columbia decreased 4.1% to $5.0 billion in August, the second consecutive monthly decline, mainly driven by lower sales of wood products. Wood product sales in British Columbia were down 18.1% to $1.0 billion in August, the lowest level since December 2020. Despite the decline, sales were up 12.0% compared with August 2020. The wood product industry has been the largest manufacturing industry in British Columbia since June 2020 and accounted for over 21% of total manufacturing sales in August.
Sales rise at fastest pace in Montréal and Toronto
Manufacturing sales on a seasonally adjusted basis rose in 10 of 12 census metropolitan areas covered by the survey in August, led by Montréal and Toronto. Saskatoon posted the largest decline.
Following a 5.8% decline in July, sales in Montréal rose 4.4% to $7.0 billion in August, the second highest sales level on record. Higher production of aerospace products and parts (+12.1%) contributed the most to the increase. Year over year, total sales in Montréal were up 16.4%.
Sales in Toronto rose 2.5% to $10.5 billion in August, the highest level since October 2020. Sales rose in 18 of 21 industries, led by higher sales of food (+2.2%), motor vehicles (+2.5%) and fabricated metal products (+3.2%). Sales of motor vehicle parts fell 2.5% month over month in August.
In Saskatoon, sales decreased 4.5% to $424.2 million in August, on lower sales of food products. Nevertheless, total sales were up 25.9% compared with the same month a year earlier.
Record high inventory levels
Total inventories increased 2.1% to a record high $96.2 billion in August, driven by higher inventories of plastic and rubber (+14.2%), chemicals (+6.0%) and food (+2.4%). Higher prices for raw materials over the past year contributed to the gains in total inventories. Year over year, total inventories rose 12.3%. Raw materials are the largest component of manufacturing inventories, followed by finished products. Their shares in total inventories have been rising since the beginning of the COVID-19 pandemic, mainly due to higher prices.
The inventory-to-sales ratio increased from 1.57 in July to 1.59 in August. The ratio measures the time, in months, that would be required to exhaust inventories if sales were to remain at their current level.
Unfilled orders increase
The total value of unfilled orders increased 0.3% to $93.8 billion in August on higher unfilled orders of computer and electronic products (+5.3%), plastic and rubber (+9.1%), fabricated metal (+1.6%) and primary metal (+2.4%). Unfilled orders of aerospace products and parts (-0.9%) decreased the most.
Following two consecutive declines, the total value of new orders rose 1.4% to $60.6 billion in August, largely attributable to the chemical (+9.1%), petroleum and coal (+7.1%) and plastic and rubber (+11.7%) product industries.
Capacity utilization rate rises on higher production
The capacity utilization rate (not seasonally adjusted) for the total manufacturing sector increased from 75.7% in July to 77.5% in August on higher production.
The capacity utilization rate rose in 14 of 21 industries in August, led by transportation equipment (+10.7 percentage points), machinery (+5.0 percentage points) and chemical (+2.3 percentage points) manufacturing. The capacity utilization rate decreased in the petroleum and coal (-2.0 percentage points) and primary metal (-1.2 percentage points) industries.
Annual Survey of Manufacturing advance estimate for 2020
Some 2020 advanced estimates from the Annual Survey of Manufacturing Industries are now available and indicate that activity decreased 10.0% from 2019 in the wake of the COVID-19 pandemic. Total revenue is estimated at $675.2 billion, revenue from goods manufactured is estimated at $630.5 billion and total expenses are estimated at $610.5 billion.
Respondents were asked how their business changed its operating methods (including both temporary and ongoing changes) in response to the COVID-19 pandemic. Almost 86% of those who responded indicated changes to operating methods, 63% mentioned asking some or all employees to work from home and 60% mentioned retrofitting the workplace.
These advance preliminary estimates will be revised with the official release of the Annual Survey of Manufacturing Industries on December 20, 2021. For information on why the Annual Survey of Manufacturing Industries estimates may differ from the Monthly Survey of Manufacturing, please consult the webpage Differences between the Annual Survey of Manufacturing Industries and the Monthly Survey of Manufacturing.