Labour Force Survey, July 2025
August 14, 2025
Employment fell by 41,000 (-0.2%) in July and the employment rate declined 0.2 percentage points to 60.7%. The unemployment rate was unchanged at 6.9%.
The employment decline in the month was concentrated among youth aged 15 to 24 (-34,000; -1.2%). Employment among core-aged (25 to 54 years old) people as well as among those aged 55 and older was little changed in July.
Employment was down across several industries, led by information, culture and recreation (-29,000; -3.3%) and construction (-22,000; -1.3%).
Employment declined in Alberta (-17,000; -0.6%) and British Columbia (-16,000; -0.5%), while it increased in Saskatchewan (+3,500; +0.6%). There was little change in the other provinces.
Total hours worked in July were little changed both in the month (-0.2%) and compared with 12 months earlier (+0.3%).
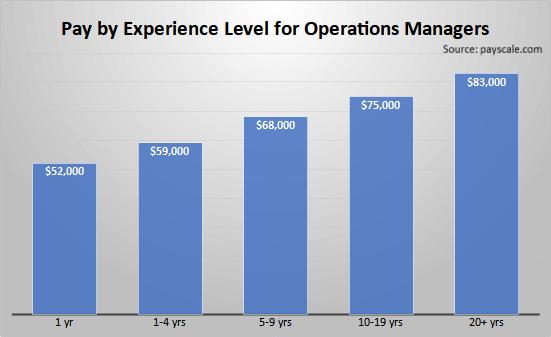
Average hourly wages among employees increased 3.3% (+$1.17 to $36.16) on a year-over-year basis in July, following growth of 3.2% in June (not seasonally adjusted).
Employment falls in July
Employment fell by 41,000 (-0.2%) in July, partly offsetting the increase in June (+83,000; +0.4%). The decline in July was concentrated in full-time work (-51,000; -0.3%). Overall, there has been little net employment growth since the beginning of the year, and the number of employed people in July was little changed compared with January (+27,000; +0.1%).
Chart 1
Employment rate falls in July, following an increase in June

The employment rate—the proportion of the population aged 15 years and older who are employed—fell by 0.2 percentage points to 60.7% in July and was down 0.4 percentage points from the beginning of the year (61.1% in both January and February).
The number of employees in the private sector fell by 39,000 (-0.3%) in July, partly offsetting a cumulative gain of 107,000 (+0.8%) in May and June. There was little change in the number of public sector employees and in the number of self-employed workers in July.
Employment decreases among youth
The employment decline in July was concentrated among youth aged 15 to 24 (-34,000; -1.2%). Youth continue to face challenging labour market conditions; the youth employment rate fell 0.7 percentage points to 53.6% in July—the lowest rate since November 1998 (excluding 2020 and 2021 during the COVID-19 pandemic).
Infographic 1
Employment rate by age group, July 2025

Employment held steady among core-aged (25 to 54 years old) men and women in July. The employment rate of core-aged women fell 0.3 percentage points to 80.0%, while for core-aged men it was little changed at 86.5%.
Unemployment rate unchanged at 6.9% as unemployed people continue to face difficulties finding work
The unemployment rate held steady at 6.9% in July, as the number of people searching for work or on temporary layoff varied little from the previous month. The unemployment rate had trended up earlier in 2025, rising from 6.6% in February to a recent high of 7.0% in May, before declining 0.1 percentage points in June.
Unemployed people continued to face difficulties finding work in July. Of the 1.6 million people who were unemployed in July, 23.8% were in long-term unemployment, meaning they had been continuously searching for work for 27 weeks or more. This was the highest share of long-term unemployment since February 1998 (excluding 2020 and 2021).
Compared with a year earlier, unemployed job searchers were more likely to remain unemployed from one month to the next. Nearly two-thirds (64.2%) of those who were unemployed in June remained unemployed in July, higher than the corresponding proportion for the same months in 2024 (56.8%) (not seasonally adjusted).
Chart 2
The unemployment rate unchanged at 6.9% in July

Despite continued uncertainty related to tariffs and trade, the layoff rate was virtually unchanged at 1.1% in July compared with 12 months earlier (1.2%). This represents the proportion of people who were employed in June but had become unemployed in July as a result of a layoff. In comparison, the layoff rate for the corresponding months from 2017 to 2019, prior to the pandemic, averaged 1.2% (not seasonally adjusted).
There were fewer people in the labour force in July, and the participation rate—the proportion of the population aged 15 and older who were employed or looking for work—fell by 0.2 percentage points to 65.2%. Despite the decrease in the month, the participation rate was little changed on a year-over-year basis.
Youth unemployment rate reaches its highest level since 2010
The youth unemployment rate edged up to 14.6% in July, the highest rate since September 2010 (excluding 2020 and 2021). The youth unemployment rate has trended up over the past two years and in July 2025 was up 4.3 percentage points compared with July 2023. Over this two-year period, increases were recorded both for young men (+5.7 percentage points to 16.2%) and young women (+2.6 percentage points to 12.8%).
Infographic 2
Unemployment rate by age group, July 2025

Chart 3
Youth unemployment rate for the five largest racialized groups in Canada, July 2025

Among the five largest racialized groups, the unemployment rate was highest among Arab youth in July, at 26.4%. Unemployment rates were also elevated for Black (23.4%), Chinese (20.5%), Filipino (19.4%) and South Asian (17.1%) youth. In comparison, the unemployment rate for non-racialized and non-Indigenous youth stood at 12.0% in July (three-month moving averages, not seasonally adjusted).
Difficult summer job market for returning students continues in July
From May to August, the Labour Force Survey (LFS) collects labour market information from students who attended school full time in March and who intend to return to school full time in the fall.
The unemployment rate for returning students aged 15 to 24 was 17.5% in July, the highest for the month of July since 2009 (excluding July 2020). The unemployment rate for returning students in July 2025 was little changed on a year-over-year basis but was up from a low of 11.2% recorded in July 2022 (not seasonally adjusted).
Returning students aged 15 to 16—who were of high school age—continued to face the most difficulties finding work. Their unemployment rate was 31.4% in July—unchanged compared with 12 months earlier. The unemployment rate was lower among older returning students aged 17 to 19 (18.0%) and those aged 20 to 24 (10.4%).
Employment down across several industries in July
Employment in information, culture and recreation declined by 29,000 (-3.3%) in July, following gains in April and May, and little change in June. Despite the decrease in July, employment in the industry was little changed on a year-over-year basis.
In construction, employment decreased by 22,000 (-1.3%) in July, following five consecutive months of little change. The number of people working in construction in July was little changed compared with 12 months earlier.
Chart 4
Employment change by industry, July 2025

Employment fell in business, building and other support services (-19,000; -2.8%), marking the third decline in the past four months for the industry. Employment also fell in health care and social assistance (-17,000; -0.6%), offsetting a similar-sized increase in June. Compared with 12 months earlier, employment in health care and social assistance was up by 54,000 (+1.9%) in July.
Employment rose in transportation and warehousing (+26,000; +2.4%) in July, the first increase since January. On a year-over-year basis, employment in this industry was little changed in July.
Employment falls in Alberta and British Columbia, while it increases in Saskatchewan
Employment in Alberta fell by 17,000 (-0.6%) in July, partly offsetting an increase of 30,000 (+1.2%) in June. The unemployment rate in the province increased 1.0 percentage points to 7.8% in July.
In British Columbia, employment declined by 16,000 (-0.5%) in July, following an increase of 13,000 (+0.4%) in May and little change in June. Losses in July were predominantly among core-aged women (-17,000; -1.8%). The unemployment rate in British Columbia increased 0.3 percentage points to 5.9% in July.
Employment held steady in Quebec in July, following an increase of 23,000 (+0.5%) in June. The unemployment rate decreased 0.8 percentage points to 5.5% in July as fewer people searched for work.
Map 1
Unemployment rate by province and territory, July 2025

Employment in Ontario was virtually unchanged in July, after increasing by 21,000 (+0.3%) in June. The unemployment rate stood at 7.9% in July, little changed from the previous month. The unemployment rate in the Toronto census metropolitan area stood at 9.0% in July, up 0.3 percentage points from the previous month (three-month moving average).
Saskatchewan was the lone province to record an employment increase in July (+3,500; +0.6%). Compared with July 2024, employment in the province was up by 16,000 (+2.6%), mostly the result of gains so far in 2025. At 5.0%, the unemployment rate in Saskatchewan was the lowest among all the provinces.
In the spotlight: Despite an uncertain economic outlook, most workers remain confident in their employment prospects
In a changing labour market, how employees perceive their employment prospects can provide insights into how factors, such as tariff-related trade uncertainty, are shaping workers’ outlooks and career decisions.
Based on additional questions asked in the LFS in July 2025, a majority (54.9%) of employees aged 25 to 64 reported being very confident in their employment prospects in their current line of work. Another 41.1% of employees were either quite confident or somewhat confident, while only 4.1% of employees reported not being confident (either not very confident or not at all confident).
Among those who were not confident in their employment prospects, the most common main reported reason was the presence of layoffs in the industry (27.5%), followed by a perceived lack of skills, experience, education or credentials (14.4%) and tariff-related trade uncertainty (12.3%). Only 6.6% cited automation or artificial intelligence as the main reason for not being confident.
Overall, employees in health care and social assistance (64.2%), utilities (62.9%), educational services (62.4%) and construction (61.2%) were most likely to be very confident in their employment prospects.
On the other hand, those in information, culture and recreation (43.8%), professional, scientific and technical services (46.9%), accommodation and food services (49.3%) and manufacturing (49.4%) were least likely to report being very confident.
Chart 5
Employees in health care and social assistance most likely to be very confident in their employment prospects

Employees working in industries dependent on US demand for Canadian exports were 7.1 percentage points less likely to be very confident in their employment prospects compared to employees in other industries (48.5% vs. 55.6%).
Moreover, employees in industries dependent on US demand for Canadian exports more often cited tariff-related uncertainty as the main reason for not being confident, compared with those in other industries (26.7% vs. 10.1%).