Building permits, October 2021
Dec 13, 2021
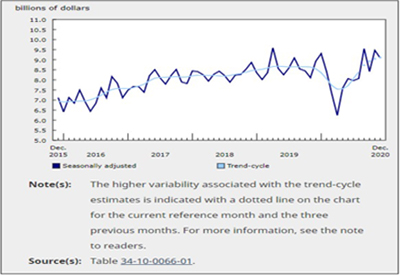
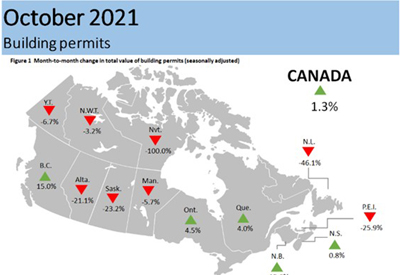
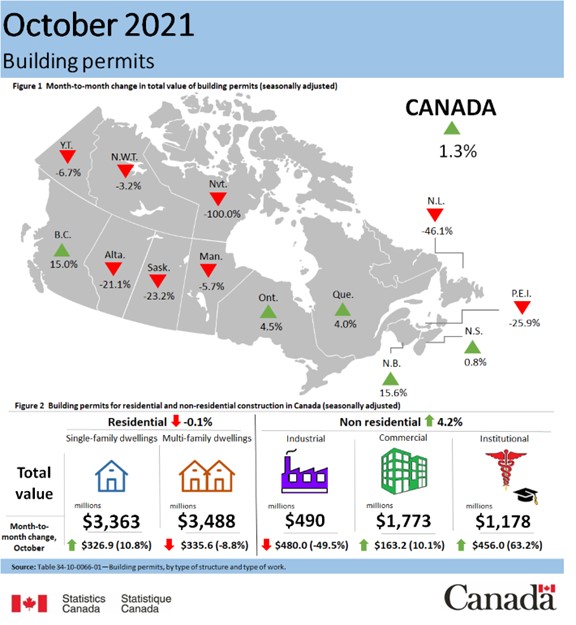
The total value of building permits increased 1.3% to $10.3 billion in October, led by gains in British Columbia (+15.0%) and Ontario (+4.5%). Construction intentions in the non-residential sector were up 4.2%, while the residential sector edged down 0.1%.
On a constant dollar basis (2012=100), building permits increased 0.7% to $7.0 billion.
New Brunswick sees big jump in residential sector
Residential construction intentions edged down 0.1% to $6.9 billion, with Ontario (-2.2%) and British Columbia (-4.9%) pulling down the sector.
Multi-family units fell 8.8% at the national level, following a strong September, mostly due to fewer higher valued permits issued in Ontario and British Columbia.
Conversely, New Brunswick (+123.8%) reported its second highest value on record, stemming from high value apartment permits in the cities of Saint John, Moncton and Shediac.
The value of permits for single-family homes rose 10.8% in October, led by Ontario (+15.1%). Saskatchewan was the only province to report a decline (-8.6%).
Non-residential sector recovery continues
Construction intentions for institutional buildings jumped 63.2%, with a $254 million Mills Memorial hospital project in Terrace, British Columbia helping construction intentions for the province to increase substantially (+528.9%) compared with the previous month.
Commercial building permits rose 10.1% for the month, with Ontario leading the way (+36.8%) with notable projects in Toronto such as the office renovation for the SickKids foundation.
September’s strong growth in industrial building permits, which largely reflected the Calgary International Airport’s Airside Maintenance expansion project, returned to more normal levels in October.
Overall, the total value of building permits in the non-residential sector at the national level rose 4.2% to $3.4 billion, 16.7% above the pre-pandemic level in February 2020.
To explore data using an interactive user interface, visit the Building permits: Interactive Dashboard.
To explore the impact of COVID-19 on the socioeconomic landscape, please consult the Canadian Economic Dashboard and COVID-19.
For more information on housing, please visit the Housing Statistics portal.
Statistics Canada has a Housing Market Indicators dashboard. This web application provides access to key housing market indicators for Canada, by province and by census metropolitan area. These indicators are updated automatically with new information from monthly releases, giving users access to the latest data.
Source: https://www150.statcan.gc.ca/n1/daily-quotidien/211201/dq211201a-eng.htm?CMP=mstatcan