January Building Permits: Residential Sector Falls for Second Consecutive Month
April 3, 2023
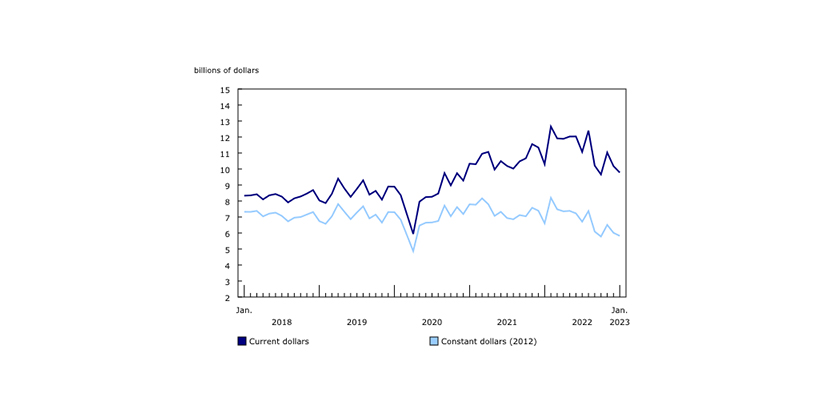
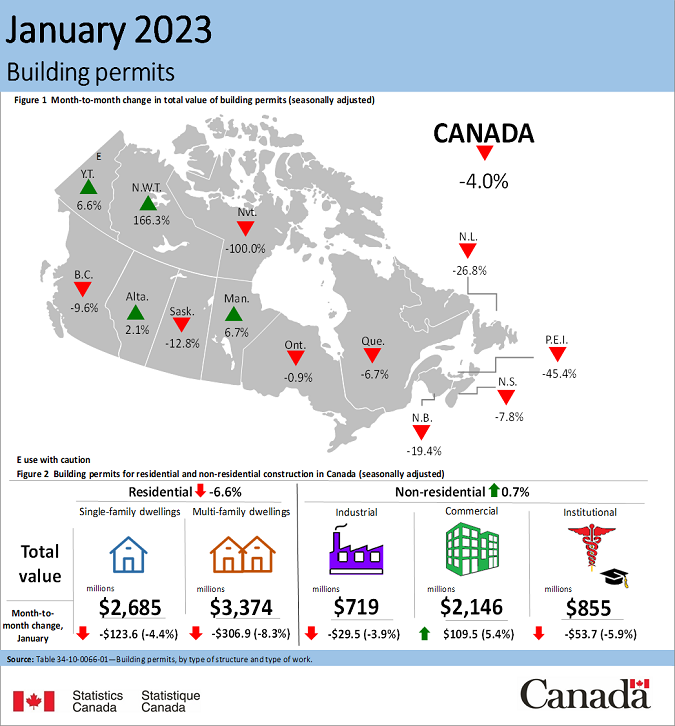
The monthly total value of building permits in Canada decreased 4.0% in January to $9.8 billion.
There were eight provinces that reported decreases in January, with the multi-residential sector in British Columbia significantly contributing to the national fall.
The residential sector declined 6.6% to $6.1 billion in January, while the non-residential sector was relatively stable, increasing a modest 0.7% to $3.7 billion.
On a constant dollar basis (2012=100), the total value of building permits went down 3.2% to $5.8 billion in January.
Residential sector falls for second consecutive month
Residential permits decreased 6.6% to $6.1 billion in January with seven provinces posting decreases.
The downward trend of multi-family homes continued as construction intentions declined 8.3% in January. Most of the decline stemmed from British Columbia (-27.9% or -$301.2 million) following a month of significant urban development intentions. Conversely, Manitoba posted a notable increase (+106.0% or +$63.0 million) in January.
Total permit values for single-family homes decreased 4.4% in January, with Quebec (-13.5% or -$74.6 million) contributing the most to the decline. Alberta (+0.8%) and British Columbia (+0.6%) were the only provinces to post increases for this component.
Non-residential sector relatively stable month-to-month
The total value of non-residential sector permits was up slightly by 0.7% to $3.7 billion in January, with gains in the commercial component offsetting losses in both the industrial and institutional components.
Commercial permit values increased 5.4% in January, with Ontario leading the charge (+22.8%). This was the second consecutive monthly increase as the component reached the third-highest recorded value since the start of the series (2011).
The value of building permits in the industrial component decreased 3.9% in January, with six provinces posting declines. After reaching its peak at over a billion dollars in November 2022, the component returned to more normal levels in January 2023.
Construction intentions in the institutional sector decreased 5.9% in January, with Quebec (-21.1%) having the biggest decline. Conversely, British Columbia jumped 43.8% due to an $87 million permit for an educational building in Kelowna.
To explore data using an interactive user interface, visit the Building permits: Interactive Dashboard.
To explore the impact of the COVID-19 pandemic on the socioeconomic landscape, please consult the Canadian Economic Dashboard and COVID-19.
For more information on housing, please visit the Housing statistics portal.
Statistics Canada has a Housing Market Indicators dashboard. This web application provides access to key housing market indicators for Canada, by province and by census metropolitan area. The indicators are updated automatically with new information from monthly releases, giving users access to the latest data.