Consumer Price Index: Annual Review, 2023
January 16, 2024
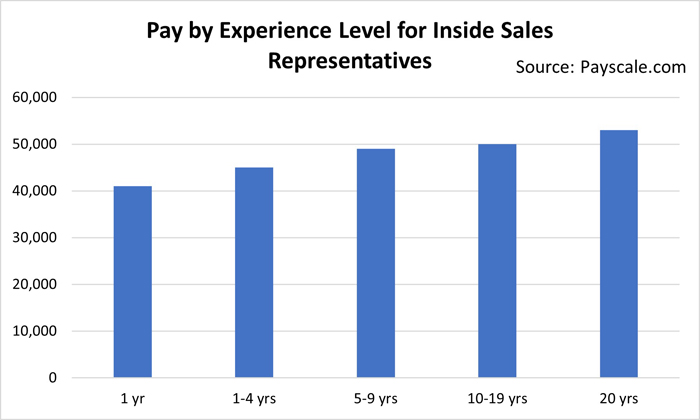
The Consumer Price Index (CPI) rose 3.9% on an annual average basis in 2023, following a 40-year high increase of 6.8% in 2022 and a 3.4% increase in 2021. Aside from 2022, the annual average increase in 2023 is the largest since 1991. Excluding energy, the annual average CPI rose 4.5% in 2023 compared with 5.7% in 2022.
Chart 1
Annual average change in the Consumer Price Index (CPI) and the CPI excluding energy, 2009 to 2023

While prices rose in every major component on an annual average basis in 2023, price growth slowed in six of eight components compared with 2022. The transportation component (+0.9%) slowed the most as a result of lower gasoline prices, with notable decelerations also seen in the food (+7.5%) and shelter (+5.6%) components.
Chart 2
Prices rise at a slower pace in all but two major components

Price growth for goods eased to 3.2% in 2023, down from 8.7% in 2022, amid the continued easing of supply chain pressures. Prices for gasoline, natural gas and food contributed to a slowdown in non-durable goods (+4.0%). Prices for durable goods also increased at a slower pace in 2023 (+1.5%) compared with 2022 (+6.2%), led by passenger vehicles amid improved supply chains and inventories compared with 2022 as the supply of semiconductors continued to improve. Lower prices for furniture and household appliances also contributed to the deceleration.
While price growth for goods slowed 5.5 percentage points in 2023, price growth for services only slowed 0.4 percentage points, resulting in a 4.6% increase. Deceleration in homeowners’ replacement cost and other owned accommodation expenses due to base-year effects was almost entirely offset by acceleration in mortgage interest cost, and to a lesser extent, rent.
Chart 3
Deceleration mainly coming from prices for goods

Despite showing a decelerating trend since January 2023, year-over-year price growth in the all-items CPI hovered between 3% and 4% for the last six months of 2023.
Infographic 1
Year-over-year all-items Consumer Price Index by month and annual average Consumer Price Index, 2023

Energy prices lead the deceleration in the Consumer Price Index
Deceleration in the annual average headline inflation was led by lower energy prices, which fell 4.2% on an annual average basis in 2023 following a 22.5% increase in 2022. The slowdown in energy prices was led by gasoline prices, which fell 7.6% in 2023 after a 28.5% increase in 2022 when crude oil prices rose due to a number of factors, including supply uncertainty resulting from Russia’s invasion of Ukraine as well as higher global demand as travel increased amid easing COVID-19 restrictions.
Prices for fuel oil, which are also related to crude oil prices, fell in 2023 (-11.2%) compared with 2022 (+59.6%).
Natural gas prices declined 4.2% in 2023 following a 26.9% increase in 2022, when commodity prices increased amid sustained global demand and uncertainty in global energy markets. In 2023, however, consumer natural gas prices eased with commodity prices.
Price growth for food slows, but remains elevated in 2023
Prices for food purchased from stores rose 7.8% on an annual average basis in 2023. While this was a smaller increase than in 2022 (+9.8%), it was still larger than the annual average increase in the all-items CPI. Grocery price inflation remained broad-based in 2023 with a number of contributing factors, including poor weather in growing regions, higher input costs, diseases such as bird flu and African swine fever, and Russia’s invasion of Ukraine. Among the grocery products with the largest price increases were edible fats and oils (+16.9%), preserved fruit and fruit preparations (+11.5%), bakery products (+10.7%), cereal products (+10.0%) and preserved vegetable and vegetable preparations (+9.7%).
Chart 4
Broad-based price growth across grocery items

Although grocery price levels remained elevated, they were relatively stable over the course of 2023, causing year-over-year growth to decelerate in all but two months, after peaking in January 2023.
Infographic 2
Grocery price levels rise at a slower rate in 2023

Consumers also paid 6.5% more to eat at restaurants on an annual average basis in 2023 following a similar increase in 2022 (+6.7%).
Homeowners’ replacement cost and other owned accommodation expenses decelerate, while mortgage interest cost and rent accelerate
On an annual average basis, shelter prices rose at a slower pace in 2023 (+5.6%) compared with 2022 (+6.9%). The slowdown stemmed from deceleration in homeowners’ replacement cost (+0.1%) and other owned accommodation expenses (-1.0%), attributable to the cooling of the housing market amid a higher interest rate environment.
At the same time, higher borrowing costs contributed to faster annual average price growth for mortgage interest cost and rent. The mortgage interest cost index rose 28.5% in 2023, the largest increase on record, as more mortgages were initiated or renewed at higher interest rates. This index was the largest upward contributor to the annual average all-items CPI in 2023.
Consumers also paid 6.5% more for rent in 2023 following a 4.6% increase in 2022. In addition to increased immigration, a higher interest rate environment may have stimulated rental demand by increasing the potential cost of homeownership.
Chart 5
Annual average change in the Consumer Price Index and special aggregates

Regional highlights
Annual average prices rose in all provinces in 2023, but at a slower pace than in 2022.
Chart 6
Prices increase at a slower pace in every province