Building Permits, May 2025

July 14, 2025
In May, the total value of building permits issued in Canada rose by $1.4 billion (+12.0%) to reach $13.1 billion. The increase in construction intentions was driven by Ontario’s institutional component (+$1.3 billion).
On a constant dollar basis (2023=100), the total value of building permits issued in May increased 11.8% from the previous month and was up 5.1% on a year-over-year basis.
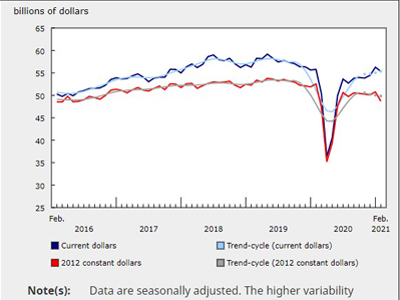
Chart 1
Total value of building permits, seasonally adjusted

Infographic 1
Building permits, May 2025

Ontario’s institutional component drives non-residential construction intentions
The value of non-residential building permits sharply increased by $1.2 billion to $5.6 billion in May, driven by Ontario’s institutional component (+$1.3 billion). Construction intentions for a new hospital in the Niagara census metropolitan area (CMA), which reached almost seven times the average value of major permits in the institutional component, led the growth in Ontario’s institutional component. The hospital construction permit also drove the national institutional component upwards to a record $2.5 billion. In constant dollar terms, the institutional component also reached a series high.
Commercial permit values increased by $87.8 million to $2.3 billion in May. Quebec (+$59.1 million) led the gains recorded in eight provinces and two territories. Ontario permit values (-$71.9 million) declined the most, after contributing significantly to growth in the non-residential sector in April.
Construction intentions in the industrial component declined by $117.2 million in May; the largest decline was in Quebec (-$50.8 million), followed by decreases in six other provinces.
Chart 2
Value of building permits for the single-family and multi-family components

Chart 3
Value of building permits for the residential and non-residential sectors

Chart 4
Value of building permits for the industrial, commercial and institutional components

British Columbia’s multi-family permits lead the residential sector
Residential construction intentions rose by $169.8 million to $7.5 billion in May. This increase was primarily led by British Columbia’s multi-family component, which grew by $687.7 million to $1.5 billion.
British Columbia’s multi-family component growth in May was driven by the Vancouver CMA (+$696.4 million), which rebounded after dipping in April.
Nationally, multi-family permit values increased by $194.8 million to $4.9 billion in May. Ontario’s multi-family component declined by $382.8 million, counteracting part of the growth in British Columbia’s multi-family component.
The value of single-family permits edged down $25.0 million to $2.6 billion in May, with the decline primarily attributed to Ontario (-$77.5 million) and mitigated by increases in seven provinces and two territories.
Across Canada, a total of 21,000 new multi-unit dwellings and 4,400 new single-family dwellings were authorized for construction in May, reflecting a slight decline of 0.2% in the total number of units authorized from the previous month.