Building Permits, July 2026
September 16, 2026
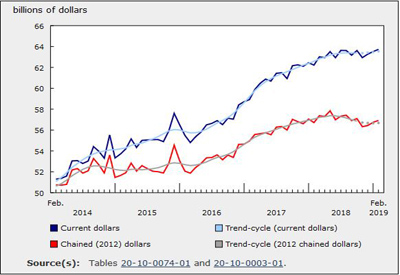
In July, the total value of building permits issued in Canada declined $2.6 billion (-17.3%) to reach $12.2 billion, more than offsetting the gain recorded in June (+$2.3 billion). The non-residential sector (-$1.9 billion) led the decrease, while the residential sector (-$701.2 million) contributed to a lesser extent.
On a constant dollar basis (2023=100), the total value of building permits issued in July declined 17.5% from the previous month and was down 2.2% on a year-over-year basis.
Chart 1
Total value of building permits, seasonally adjusted

Infographic 1
Building permits, July 2026

Ontario leads the decline in institutional construction intentions
The value of non-residential building permits fell $1.9 billion to $5.0 billion in July. The institutional component (-$1.5 billion to $1.7 billion) led the decline, followed by the industrial component (-$443.3 million to $795.5 million). Meanwhile, the commercial component recorded moderate growth (+$41.0 million to $2.5 billion).
After leading the growth in the institutional component in June, Ontario (-$1.1 billion) drove the reduction in institutional construction intentions in July. The decline was supported by Quebec (-$228.2 million) and British Columbia (-$169.0 million).
In July, losses in the industrial component were led by Saskatchewan (-$191.8 million), followed by Ontario (-$147.7 million) and Alberta (-$93.1 million). Overall, six provinces and one territory contributed to the decrease.
The growth in the commercial component in July was primarily attributable to Quebec (+$184.8 million) and supported by British Columbia (+$116.3 million). Ontario (-$190.4 million) dampened the increases.
Chart 2
Number of units authorized for the residential sector and for the single-family and multi-family components

Chart 3
Value of building permits for the residential and non-residential sectors

Chart 4
Value of building permits for the single-family and multi-family components

Chart 5
Value of building permits for the industrial, commercial and institutional components

Multi-unit component drives the residential sector decline
Residential construction intentions declined $701.2 million to $7.2 billion in July. The multi-unit component (-$531.8 million to $4.7 billion) accounted for most of the decline, while the single-family component (-$169.4 million to $2.5 billion) contributed less significantly.
British Columbia (-$198.0 million), Alberta (-$115.8 million) and Quebec (-$91.8 million) led the decline in the multi-unit component in July. Overall, nine provinces and two territories contributed to the decrease.
Meanwhile, eight provinces and two territories recorded a decrease in the single-family component in July, led by Quebec (-$116.1 million).
Across Canada, 19,200 multi-unit dwellings and 4,100 single-family dwellings were authorized in July, a 10.1% decrease from the previous month. From August 2025 to July 2026, the total number of multi-unit dwellings authorized was 297,100, down from 308,200 in the previous 12-month period.