Building Permits, June 2026
August 17, 2026
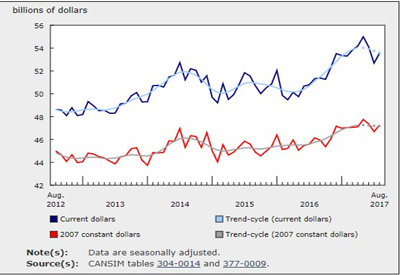
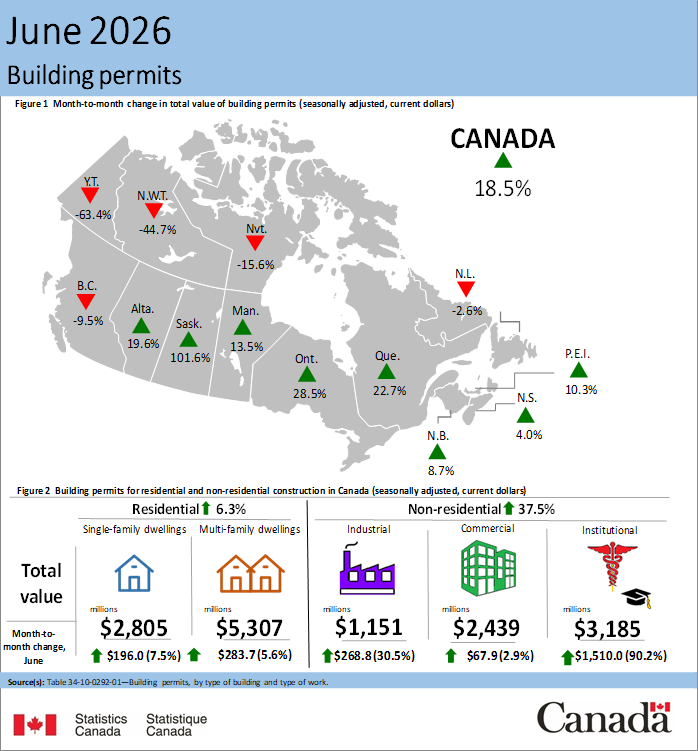
In June, the total value of building permits issued in Canada rebounded by $2.3 billion (+18.5%) to reach $14.9 billion, more than offsetting the monthly declines recorded in April (-$536.7 million) and May (-$383.3 million). The growth in construction intentions in June was led by the non-residential sector (+$1.8 billion), while the residential sector (+$479.7 million) made a smaller contribution.
On a constant dollar basis (2023=100), the total value of building permits issued in June rose 18.0% from the previous month and was up 18.6% on a year-over-year basis.
Chart 1
Total value of building permits, seasonally adjusted

Infographic 1
Building permits, June 2026
Institutional projects drive the sharp increase in non-residential building permits
The value of non-residential building permits grew $1.8 billion to $6.8 billion in June. The institutional component (+$1.5 billion to $3.2 billion) led the increase, while the industrial (+$268.8 million to $1.2 billion) and commercial (+$67.9 million to $2.4 billion) components contributed to a lesser extent.
In June, the gain in the institutional component was bolstered by Ontario (+$1.3 billion) and concentrated in the Toronto census metropolitan area (CMA), where there were newly approved building permits for a medical institution. The gain was also supported by Quebec (+$238.7 million).
The rise in the industrial component in June was driven by Saskatchewan (+$189.5 million), followed by Ontario (+$104.2 million). Quebec (-$53.6 million) tempered the increase.
Meanwhile, seven provinces contributed to the increase in the commercial component, led by Ontario (+$106.0 million).
Chart 2
Number of units authorized for the residential sector and for the single-family and multi-family components

Chart 3
Value of building permits for the residential and non-residential sectors

Chart 4
Value of building permits for the single-family and multi-family components

Chart 5
Value of building permits for the industrial, commercial and institutional components

Multi-unit component leads residential increase
In June, residential construction intentions rose $479.7 million (+6.3%) to $8.1 billion. The increase was primarily attributable to the multi-unit component (+$283.7 million to $5.3 billion) and was supported by the single-family component (+$196.0 million to $2.8 billion).
The gain in the multi-unit component in June was driven by Quebec (+$201.3 million) and supported by Alberta (+$143.4 million) and Saskatchewan (+$61.4 million). Overall, eight provinces and two territories contributed to the increase.
Alberta (+$110.8 million) led the increase in the single-family component in June, followed by Quebec (+$85.4 million). British Columbia (-$30.8 million) tempered the gain.
Quarterly review: Non-residential sector drives the increase in second quarter
In the second quarter of 2026, the total value of building permits increased $1.4 billion to $40.4 billion, up 3.7% from the previous quarter. On a constant dollar basis (2023=100), the total value of building permits was up 2.7% to $36.6 billion.
The remainder of this release will use constant dollars (2023=100).
The value of non-residential building permits rose $1.9 billion to $15.4 billion in the second quarter, marking the largest quarterly increase in the series. This increase was driven by Ontario, largely due to its institutional component (+$1.6 billion).
In the second quarter, Ontario drove the national institutional component to a quarterly record high of $6.1 billion. Hospital construction intentions in the Toronto CMA supported the increase within the province.
The total value of building permits for the commercial component increased $611.2 million to $6.4 billion in the second quarter. This gain was primarily attributable to Ontario (+$427.9 million) and supported by Quebec (+$137.2 million) and Yukon (+$83.8 million). Meanwhile, the industrial component declined $492.3 million to $2.9 billion. Overall, six provinces and two territories contributed to the decrease.
The residential sector fell $944.2 million (-4.3%) to $21.1 billion in the second quarter. The multi-unit component (-$873.7 million to $13.8 billion) accounted for most of the decline. Losses in the multi-unit component were led by Ontario (-$582.4 million) and British Columbia (-$386.2 million). Alberta (+$180.1 million) moderated the decline.
Nationwide, a total of 80,000 single-family and multi-family units (not seasonally adjusted) were authorized for construction in the second quarter, down from the 82,200 units authorized during the same period one year earlier.