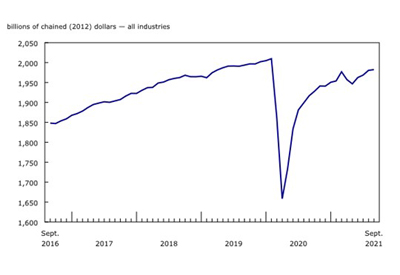
Using Data to Forecast Your Sales

Have you ever noticed that each fall, many newspapers start to talk about recession? If you track the stock market, you will notice that the market “corrects” itself in the fall. Most analysts will tell you it has as much to do with coming back from vacation as it does with the economy. What is interesting is that the data have a pattern, and that over time it shows trends.
Electro-Federation Canada (EFC) provides quarterly distributor sales data and tracks the patterns and trends affiliated with that data as well.
Let’s first look at data patterns. Figure 1 shows sales data collected over the last nine quarters. If you look closely, you’ll see this pattern: first quarters show a dramatic decline in sales.
Figure 2 shows each first quarter with the use of yellow lines — the data show a decline in sales from the fall quarter. Much like the stock market corrects itself in the fall, we “correct” ourselves in the winter, or more likely, simply sell less in the colder months. I do not have the data, but I would guess that all geographical areas would suffer through rainy seasons and hot summers. I have added a red line to show the growth of sales averaged out. The “correction” for our industry might be in the quarters that have more ideal weather; sales that don’t take place in the winter take place in the spring or summer months.
Figure 1

Figure 2

Moreover, if we take data for each year and put them over top of one another, a pattern shows itself again in Figure 3. The patterns help us determine the average quarterly percentage as a percentage of the total year. We then get Figure 4, which shows a range between 23% (first quarter) and just under 26% (last quarter). Knowing the average annual percentage for each quarter can assist in determining projected sales.
Figure 3

Figure 4

We all know that 2014 was a cold year. As we saw, Figure 2 showed that sales dipped dramatically from other winter declines and there was a bounce back. By using a consistent quarterly percentage, we can take into consideration the cold winter and the bounce to project a fourth quarter for 2014 — as shown in Figure 5, which forecasts the projection. The graph shows a dip in the sales projection, or at least a leveling off, to adjust for the construction corrections made in the summer from the cold winter.
Figure 5

This is not the projected course we would have considered if we just extended the 2014 line. For a more accurate reading, we need more years of data. For example, are warehouse and direct sales both affected in the same way, or do they have different patterns? Can we use a number of “good” years to clearly establish more accurate percentages versus bad years? I only used the last two years to determine the percentage and tested it with an earlier year.
Once we establish patterns, we can begin to look at the data for trends, or changes, that are taking place. Patterns are repeated while trends tend to be non-linear.
Here is one trend that I will leave you with: Figure 6 looks at sales data from a regional perspective over time.
Figure 6

The chart shows regions as a percentage of Canada annual sales. Alberta and the Prairies have grown, taking market share away from Ontario and Quebec. This trend would be guessed by many without the data. The data confirm the west’s growth and qualify it.
Finding patterns and trends in data is really just another way of classifying the world around us. It helps us simplify what we take in and how we can respond.
Rick McCarten is VP, Electrical Council, Electro-Federation Canada.