Provincial and Territorial GDP for 2013
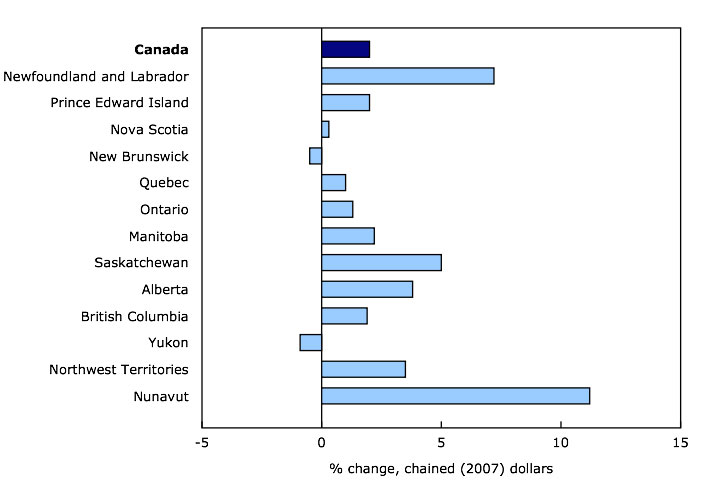
Real gross domestic product (GDP) increased in all provinces and territories in 2013, with the exception of New Brunswick and Yukon. Nunavut (+11.2%) and Newfoundland and Labrador (+7.2%) had the largest increases in real GDP. Nationally, real GDP rose 2.0%, slightly above the increase in 2012.
Economic growth in Quebec (+1.0%) and Ontario (+1.3%) was below the national average. Saskatchewan (+5.0%) and Alberta (+3.8%), in turn, surpassed the national average for the fourth year in a row.
Chart 1: Real gross domestic product, 2013
Household final consumption expenditure increased in all provinces and territories except Yukon, where it edged down 0.1%. Alberta recorded the largest increase in household spending (+4.3%). Household spending grew at a faster pace in all jurisdictions except Saskatchewan, Alberta, Yukon and Nunavut. Nationally, household spending grew 2.5%, compared with a 1.9% gain in 2012.
Business gross fixed capital formation grew 0.8% nationally after increasing 7.0% in 2012. Nunavut (+35.0%) and Newfoundland and Labrador (+26.2%) posted the largest increases, while Yukon (-18.1%) and New Brunswick (-12.1%) recorded the largest declines. Among the 13 jurisdictions, 8 posted slower growth compared with the previous year.
Business gross fixed capital formation in residential structures declined 0.4% nationally after increasing 5.7% the previous year. Yukon (-18.3%) had the largest decline. All jurisdictions with the exception of Nunavut posted slower growth in 2013.
Nationally, business gross fixed capital formation in non-residential structures, machinery and equipment rose 2.6%, after increasing 9.0% the previous year. Newfoundland and Labrador, Prince Edward Island, Nova Scotia, Manitoba, Alberta, Yukon, the Northwest Territories and Nunavut all posted increases higher than the national average.
All provinces and territories with the exception of Nova Scotia (-1.9%) and New Brunswick (-3.9%) exported more goods and services in 2013 than in 2012. However, most provinces and territories posted slower growth than in 2012. Nationally, exports were up 2.0%, compared with a 2.6% gain in the previous year.
Imports of goods and services rose in most provinces and territories, with Newfoundland and Labrador posting the largest increase (+11.8%). Nationally, imports were up 1.3% in 2013, after increasing 3.7% in the previous year. Newfoundland and Labrador, Prince Edward Island, Nova Scotia, the Northwest Territories and Nunavut all posted stronger growth than in 2012.
Compensation of employees advanced in all provinces and territories, with Alberta posting the largest increase (+7.3%). Nationally, compensation of employees rose 3.7% in 2013, compared with an increase of 4.6% in 2012. All provinces and territories except Nova Scotia, New Brunswick and British Columbia posted slower growth than in 2012.
The net operating surplus of corporations was lower in all jurisdictions except Newfoundland and Labrador, Prince Edward Island, Ontario, Alberta and Nunavut. Nationally, the net operating surplus of corporations declined 0.6%, following a 4.2% decrease in 2012.
Household disposable income was higher in all provinces and territories, led by Saskatchewan (+8.6%) and Alberta (+8.0%). A 49.8% rise in gross mixed farming income contributed to the increase in Saskatchewan, while a 14.3% gain in net property income contributed to the growth in Alberta. Nova Scotia, Ontario, Saskatchewan and British Columbia were the only jurisdictions to post stronger growth in 2013 than in 2012. Nationally, household disposable income increased 3.8%, a slower pace than that of 4.2% recorded the previous year.
Atlantic Canada
Newfoundland and Labrador’s real GDP advanced 7.2% in 2013 after declining 4.5% the previous year. Growth was driven by business gross fixed capital formation (+26.2%) and exports of goods and services (+9.8%). Investment in non-residential structures, machinery and equipment rose 40.0%.
Real GDP in Prince Edward Island rose 2.0%, continuing the positive trend that started in 2002. Exports of goods and services contributed the most to overall growth, increasing 4.5%. Exports to other countries were up 7.3%, while those to other provinces rose 2.4%. Household final consumption expenditure increased 1.6% in 2013, following a 1.0% gain in 2012. Business gross fixed capital formation (+9.3%) rose after a significant downturn (-5.2%) in 2012.
In Nova Scotia, real GDP grew 0.3% after declining 0.3% in 2012. Household final consumption expenditure rose 2.0% and contributed significantly to the overall gain. The increase in household final consumption expenditure was led by a 6.8% rise in durable goods. A worsening trade balance dampened growth.
Real GDP in New Brunswick declined 0.5% in 2013 after contracting 0.4% in 2012. Lower exports (-3.9%) contributed the most to the decline. Exports of goods and services to other provinces fell 5.9%, while exports to other countries were 2.2% lower. Household final consumption expenditure rose 1.9%, following a 0.5% increase in 2012.
Central Canada
Real GDP grew 1.0% in Quebec in 2013, compared with an increase of 1.5% in 2012. Growth was mostly driven by a 2.0% gain in household final consumption expenditure. Business gross fixed capital formation decreased 5.2%, after increasing for three consecutive years.
Ontario’s real GDP rose 1.3%, driven by increased household final consumption expenditure (+2.1%). The province recorded a 1.8% increase in exports, a slower pace than the average annual gain of 5.7% observed during the previous three years. Business gross fixed capital formation was down 4.2% as a result of lower business outlays on non-residential structures, machinery and equipment (-6.7%), as well as on residential structures (-2.3%).
Western Canada
Manitoba’s real GDP rose 2.2%, as household final consumption expenditure increased 2.6%. Outlays on durable goods were up 8.1%. Business gross fixed capital formation (+5.5%) and exports of goods and services (+1.4%) were also higher.
Saskatchewan’s real GDP increased 5.0% in 2013, following a 3.1% rise in 2012. Businesses accumulated $3.2 billion, mainly in farm inventories, which contributed to the increase in GDP. Household final consumption expenditure rose 3.5%, while business gross fixed capital formation declined 2.1%.
Alberta’s real GDP advanced 3.8% in 2013 after increasing 4.5% in 2012. Growth was driven by increased business gross fixed capital formation (+8.5%). Household final consumption expenditure (+4.3%) and exports of goods and services (+2.7%) were also higher.
British Columbia’s real GDP expanded 1.9% in 2013, as household final consumption expenditure rose 2.5%. Exports of goods and services (+2.5%) also contributed to the increase. In turn, business gross fixed capital formation was down 0.5%.
The territories
Yukon’s real GDP decreased 0.9% in 2013 following an increase of 2.6% in 2012. Business gross fixed capital formation fell 18.1% for the year, following a 25.4% decline in 2012. Investment in residential (-18.3%) and non-residential (-21.9%) structures were both lower.
The Northwest Territories’ real GDP rose 3.5% in 2013. Business gross fixed capital formation (+14.9%), mainly driven by increased investment in non-residential structures, contributed the most to the overall gain. Exports of goods and services (+4.3%) and household final consumption expenditure (+1.7%) were also higher.
Nunavut’s real GDP grew 11.2% in 2013, after increasing 1.2% in 2012. The gain was driven by increased business gross fixed capital formation (+35.0%), mainly business investment in non-residential structures.
Resource-rich provinces increase their share of national income
The resource-based economies of Newfoundland and Labrador, Saskatchewan and Alberta have seen their share of national income increase since 2003, while Quebec and Ontario have seen their share decline.
In 2013, the combined nominal GDP of Newfoundland and Labrador, Saskatchewan and Alberta accounted for 24.1% of national GDP. In 2003, their share was 18.4%. Conversely, Quebec and Ontario have seen their combined share of national GDP fall from 61.5% in 2003 to 55.9% in 2013.
Source: Statistics Canada, http://www.statcan.gc.ca/daily-quotidien/141105/dq141105a-eng.htm?cmp=mstatcan.