Electricity Generation and Exports Declined in May as Other Energy Sources Rose
Aug 13, 2019
The production of crude oil and equivalent products (+1.9%), natural gas (+3.5%) and coal (+9.7%) was higher in May compared with the same month a year earlier, while electricity generation (-1.5%) declined. Meanwhile, exports of crude oil and equivalent products increased (+2.9%), while exports of natural gas (-7.1%) and electricity (-19.8%) decreased.
Crude oil and equivalent products
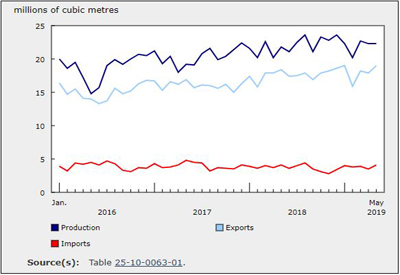
Production of crude oil and equivalent products rose 1.9% to 22.3 million cubic metres (140.0 million barrels) in May compared with the same month a year earlier. The year-over-year increase was primarily attributable to synthetic crude oil production, up 8.7% to 5.1 million cubic metres, and equivalent products, up 18.0% to 2.0 million cubic metres. Production of heavy crude oil (+1.6%) and light and medium crude oil (+1.2%) was also up.
The production increase in May was slightly offset by a 4.2% decline in crude bitumen production to 8.7 million cubic metres, due to lower levels of in-situ activity. Monthly crude bitumen production has averaged 8.4 million cubic metres since production limits were implemented in January in Alberta, compared with 8.6 million cubic metres during the same period in 2018.
Alberta produced 17.9 million cubic metres of crude oil and equivalent products in May, up 1.5% from the same month a year earlier. Production of equivalent products (+18.5% to 1.7 million cubic metres) was the primary reason for the increase.
Meanwhile, crude oil production was unchanged at 16.2 million cubic metres compared with May 2018, because of scheduled maintenance work and other operational issues at facilities in northern Alberta.
Alberta (80.4% of total production), Saskatchewan (10.9%) and Newfoundland and Labrador (6.0%) accounted for the vast majority of Canadian production of crude oil and equivalent products.
Newfoundland and Labrador production totalled 1.3 million cubic metres in May, the highest level since August 2011.
Pipelines in Canada received 19.0 million cubic metres of crude oil and equivalent products from fields and plants in May, down 10.0% compared with the same month in 2018. The majority of these receipts (84.2%) originated in Alberta. From January to May 2019, when production limits on crude oil were implemented in Alberta, the monthly receipts of pipelines averaged 19.1 million cubic metres compared with an average of 21.2 million cubic metres during the same period in 2018.
In May, pipelines delivered 7.6 million cubic metres of crude oil to Canadian refineries and upgraders, up 17.2% compared with the same month in 2018, when scheduled maintenance at major refineries limited crude deliveries. Over 70% of the total volume was delivered to refineries and upgraders in Western Canada.
Exports of crude oil and equivalent products continued to rise, up 2.9% to 19.0 million cubic metres in May, the highest level in four months. Exports to the United States via pipelines increased 0.7% year over year to 16.1 million cubic metres. Overall, pipelines were the main mode of transport, accounting for 84.7% of total exports in May. Exports to the United States by other means (rail, truck and marine) increased 49.1% year over year to 2.3 million cubic metres, while exports to other countries were down.
Imports of crude oil and equivalent products increased 1.4% year over year to 4.1 million cubic metres in May.
Refined petroleum products
In May, net production of motor gasoline (which consists of motor gasoline and blending components) totalled 3.4 million cubic metres, while net production of diesel fuel oil was 3.0 million cubic metres. Meanwhile, closing inventories held at refineries, terminals and upgraders amounted to 2.2 million cubic metres of motor gasoline and 1.7 million cubic metres of diesel fuel oil.
Natural gas
Canadian marketable natural gas production totalled 579.5 million gigajoules in May, up 3.5% from the same month a year earlier. Alberta (71.9%) and British Columbia (26.3%) accounted for the vast majority of Canadian natural gas production.
Over the same period, natural gas transmission and distribution systems delivered 256.7 million gigajoules to Canadian consumers. The majority (77.9% or 199.9 million gigajoules) was delivered to industrial users, while the remainder went to residential consumers (31.9 million gigajoules) and to the commercial and institutional sector (24.9 million gigajoules).
Deliveries of natural gas in Alberta totalled 143.9 million gigajoules in May. The vast majority (92.1%) was sent to the industrial sector, which accounted for over half of all natural gas delivered in Canada.
Meanwhile, natural gas transmission and distribution systems delivered 51.3 million gigajoules to Ontario. Of this total, 18.0 million gigajoules were delivered to the province’s residential sector, which accounted for over half (56.5%) of deliveries to residential consumers in Canada.
Opening inventories of natural gas held in Canadian storage facilities stood at 551.7 million gigajoules in May. During the month, inventories increased 11.4% to close at 614.7 million gigajoules. This was the second consecutive monthly increase as storage facilities tend to build inventories during the warmer months in preparation for greater demand in the winter.
Canadian exports of natural gas by pipeline to the United States declined 7.1% year over year to 237.6 million gigajoules in May. Over the same period, imports of natural gas from the United States by pipeline continued to increase, with most of the imports going to Ontario.
Electricity
In May, electricity generation in Canada totalled 47.3 million megawatt-hours (MWh), down 1.5% compared with the same month a year earlier. Renewable generation (hydro, wind, solar, tidal and others) declined 3.6% to 30.7 million MWh. In contrast, electricity generated from combustible fuels rose 3.3% to 9.4 million MWh, and nuclear generation was up 1.4% to 7.2 million MWh.
By generation type, hydro was the largest contributor to Canada’s electricity production, accounting for 28.4 million MWh of electricity, down 2.7% year over year. Quebec generated almost half of the total hydro-electricity in May (13.9 million MWh), while British Columbia (3.9 million MWh) and Newfoundland and Labrador (2.8 million MWh) were also major contributors.
Alberta (5.6 million MWh) and Saskatchewan (1.6 million MWh) generated the most electricity from combustible fuels in May, while the vast majority of nuclear electricity was generated in Ontario (96.4%), with the remainder produced in New Brunswick.
n May, exports of electricity to the United States were down 19.8% to 4.5 million MWh compared with the same month in 2018. Quebec was the main exporting province (1.7 million MWh), followed by Ontario (1.4 million MWh) and Manitoba (0.9 million MWh). Meanwhile, imports of electricity from the United States increased 13.5% to 1.2 million MWh, with most of the imports going to British Columbia (1.0 million MWh).
Coal and coke
Canada produced 4.5 million tonnes of coal in May, up 9.7% compared with the same month a year earlier. Meanwhile, coke production decreased 3.0% to 214.4 thousand tonnes.
For more information on energy in Canada, please visit the Canadian Energy Information Portal.
Source: Statistics Canada, www150.statcan.gc.ca/n1/daily-quotidien/190806/dq190806a-info-eng.htm